-
- Contact Us
- Privacy Policy
- term and condition
- Cookies policy

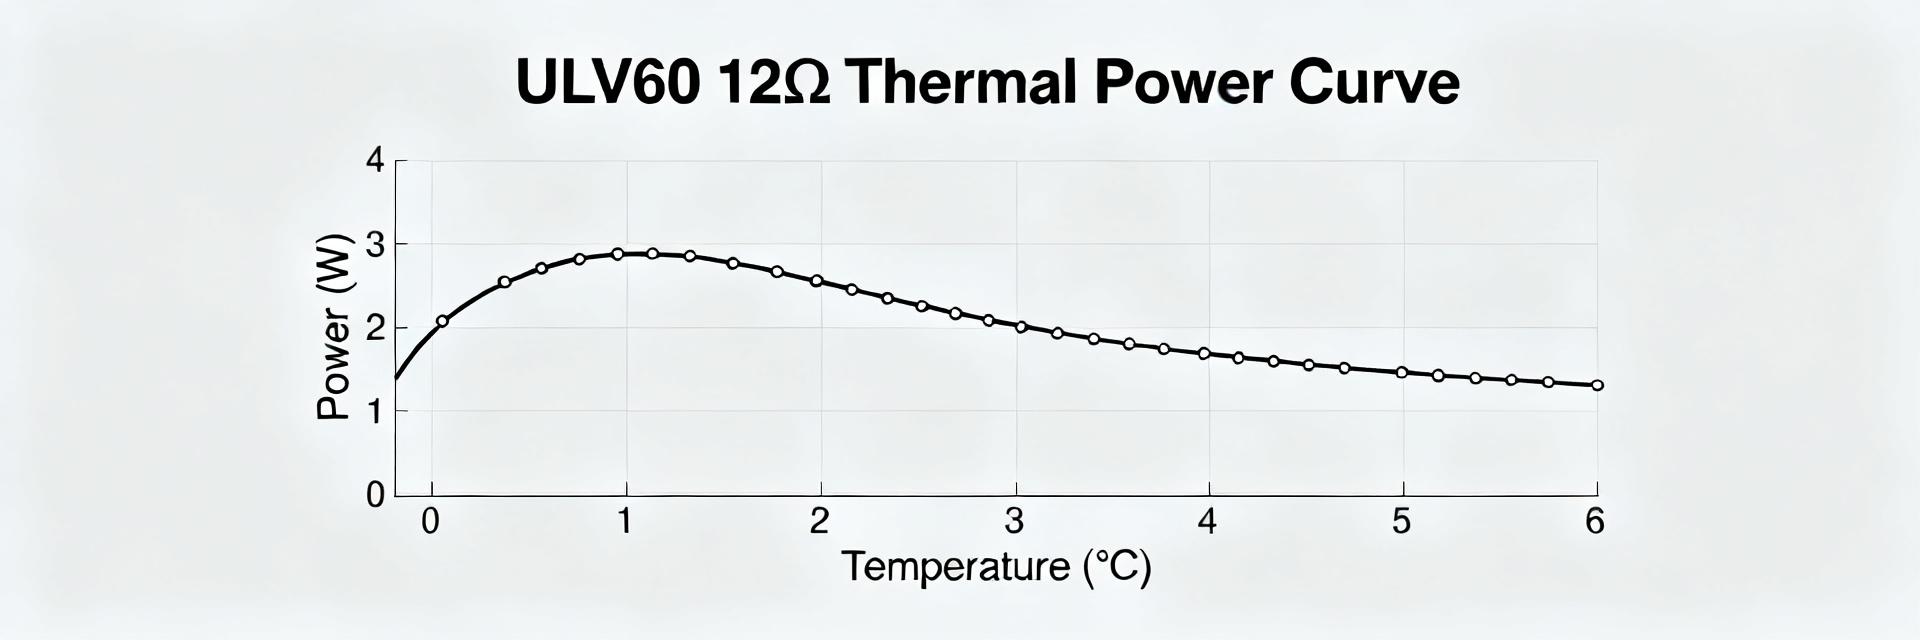
ULV60 12Ω Datasheet: Power Specs & Thermal Curve Guide
Point: Correctly interpreting the ULV60 12Ω datasheet and its thermal curve prevents performance surprises and failures.
Evidence: Engineers who take nominal power at face value often discover reduced usable power once mounting, ambient, and duty cycle are considered.
Explanation: This guide highlights where manufacturers put key caveats on rated power, how mounting method alters continuous current, and why reading the thermal curve is mandatory for reliable designs.
Point: Use a data-driven approach to extract usable limits.
Evidence: Datasheet fields such as rated power, mounting condition, and surge windows directly determine safe operating envelopes.
Explanation: Read the datasheet together with an annotated thermal curve and simple calculations to convert power to current and voltage before deployment.
(1) Quick overview: what the ULV60 12Ω spec sheet actually covers (background)
Key electrical specs to surface immediately
Point: First-glance fields set design boundaries. Evidence: Pull nominal resistance (12Ω), tolerance, rated power under each mounting condition, maximum working voltage, rated continuous current, and the temperature coefficient from the datasheet. Explanation: Capture these in a compact spec box to avoid misreading vendor tables when sizing supplies, fuses, or protection.
| Parameter | Typical Value / Notes |
|---|---|
| Nominal resistance | 12 Ω |
| Tolerance | ±5% (example) |
| Rated power | 60 W (heatsink); lower in free-air — check datasheet condition |
| Max working voltage | Refer to datasheet voltage limit |
| Rated current | Calculated from P and R (see calc block) |
| Temp coefficient | ppm/°C — affects resistance at operating temp |
Mechanical & mounting summary and why it matters
Point: Mounting changes thermal path and usable power. Evidence: Datasheet differentiates chassis- or heatsink-mounted ratings from free-air ratings and lists footprint, mounting torque, and max ambient. Explanation: Note orientation (vertical/horizontal), required fastener torque, and maximum ambient: these determine the thermal curve applicable to your build and whether derating must be applied.
(2) How to read and verify the power ratings (data analysis)
Rated power vs. real-world usable power
Point: Rated power is conditional, not absolute. Evidence: Manufacturers commonly specify multiple power limits depending on heatsink contact or free-air placement. Explanation: Verify which line in the datasheet applies by cross-checking mounting notes, whether a thermal interface material is assumed, and the stated ambient; use a checklist to confirm applicability before trusting a numeric rating.
Calculating rated current and voltage for 12Ω
Point: Convert power to current and voltage to size supplies and fusing. Evidence: Use I = sqrt(P/R) and V = I × R; for a 60 W rating and 12 Ω nominal: I = sqrt(60/12) ≈ 2.236 A, V ≈ 26.8 V. Explanation: Account for tolerance and temperature coefficient—resistance can shift, changing actual current and dissipation. Round conservatively and document assumptions in the purchase or test plan.
(3) Understanding the thermal derating curve (data analysis / thermal)
Interpreting ambient temperature vs. % power curves
Point: The thermal curve links ambient temperature to allowable % of rated power. Evidence: Curves plot % power (vertical) against ambient (horizontal) and are conditioned on mounting (heatsink vs. free air). Explanation: Read the curve at your expected ambient and mounting condition to find operating % of rated power—e.g., a 25°C baseline often corresponds to 100% on-heatsink, while higher ambients require proportional derating to avoid overheating.
Time-limited surge and duty-cycle considerations
Point: Short surge ratings permit temporary higher power but do not change continuous limits. Evidence: Datasheets commonly specify surge power for fixed durations (seconds or minutes) and list recovery conditions. Explanation: Use RMS heating and duty-cycle math to ensure average dissipation stays below derated continuous power; include surge tests in validation and avoid relying on short bursts for routine operation.
(4) Thermal-resistance, mounting, and heat-sink best practices (method guide)
Quantifying thermal resistance and mounting conductance
Point: Thermal resistance buckets define junction-to-ambient paths. Evidence: For metal-clad resistors, junction-to-chassis and chassis-to-ambient resistances sum to determine steady-state temp rise. Explanation: Estimate or measure thermal resistance by applying known power, measuring steady-state case and ambient, and computing °C/W; use thermal imaging to validate conduction paths and good mechanical contact.
Practical heat-sink selection and installation tips
Point: Heatsink selection should be heuristic and test-driven. Evidence: Choose heatsink with low °C/W, correct mounting footprint, and adequate fin area for expected airflow; use a thin, compliant thermal interface to improve conductance. Explanation: Specify minimum airflow (e.g., forced convection vs. natural) and target a case-to-ambient rise that keeps component case well below max rated temperature to extend life.
(5) Test procedures and validation checklist before deployment (method guide / actionable)
Thermal testing protocol (what to measure and how)
Point: Validate expected operating envelope with tests. Evidence: Run steady-state power tests, surge tests, and ambient sweeps while recording case, ambient, and any hot spots with thermocouples and thermal camera. Explanation: Define pass/fail on max case temperature and thermal curve conformity; for example, ensure RMS dissipation at expected duty cycle does not exceed derated continuous power from the datasheet.
Electrical and mechanical validation checklist
Point: Combine electrical verification with mechanical checks. Evidence: Verify resistance & tolerance at operating temp, perform insulation and residual voltage tests, and confirm torque/fastener values and vibration resilience. Explanation: Produce a field checklist snippet for quick pre-deployment signoff listing measured resistance, measured case temp at power, mounting torque, and pass/fail for vibration if required.
(6) Selection tips and a quick field example (case study + action)
Component selection checklist for designers
Point: Choose with margin and context. Evidence: Design for 70–80% of rated power under expected ambient, confirm surge windows, select mounting type, and account for environment (dust, altitude). Explanation: Include safety margins in procurement language and require datasheet thermal curve plots and mounting notes in supplier responses; suggested long-tail queries include "ULV60 12Ω thermal derating guide" and "how to read thermal curve for ULV series resistors."
Walk-through example: sizing a ULV60 12Ω resistor for a 30°C ambient, 50 W continuous load
Point: Apply calculations and the derating curve to decide fixes.
Evidence: For 50 W into 12 Ω, I = sqrt(50/12) ≈ 2.041 A, V ≈ 24.5 V.
Explanation: If the datasheet's heatsink rating is 60 W but free-air rating is lower at 30°C, confirm the curve: if 50 W exceeds the free-air continuous % at 30°C, add a heatsink, increase spacing, or choose a resistor with a higher continuous rating. Verify with thermal sweep.
Summary (conclusion)
Point: Three critical takeaways consolidate safe practice. Evidence: Always map rated power to your mounting condition on the datasheet and use the thermal curve and surge specs to size for duty cycle; validate with thermal testing and margining. Explanation: For reliable deployment, interpret datasheet conditions, apply derating conservatively, and confirm with measurement—run the quick checklist and a thermal sweep before final acceptance. ULV60 12Ω and datasheet references should guide each step.
Key summary
- Always confirm which rated power on the datasheet applies to your mounting; incorrect assumption reduces lifetime and risks overheating.
- Use the thermal curve to convert ambient into allowable % power and calculate actual current/voltage from P and R before specifying components.
- Plan for surge windows and duty cycle using RMS heating; validate with steady-state and surge tests using thermocouples or thermal imaging.
FAQ
How do I interpret the ULV60 12Ω datasheet to find continuous power?
Read the section that lists power by mounting condition (heatsink vs free-air), then consult the thermal curve at your expected ambient. Continuous power is the rated power multiplied by the % shown on the curve for that ambient and mounting—verify with a steady-state test.
What does the thermal curve on the datasheet mean for my ULV60 12Ω installation?
The thermal curve maps ambient temperature to permissible percentage of rated power under specified mounting. Use it to derate continuous power at higher ambients; if your needed power exceeds derated limits, change mounting or add heatsinking and re-test.
How should I validate ULV60 12Ω surge claims in the datasheet?
Perform timed surge tests matching datasheet durations and record temperature recovery. Confirm the component returns to baseline without damage and that average RMS dissipation over duty cycles stays below derated continuous limits; document pass/fail criteria before field use.
-
 ULV 500 N Datasheet Analysis: Key Specs & Limits Explained2026-05-07 10:26:17 0Reading the ULV 500 N 0.4 J datasheet accurately is a practical necessity for reliable systems: a mistaken continuous power assumption or a misread pulse‑energy limit can turn a high‑duty resistor into a rapid failure point. Typical design numbers to watch are continuous dissipation in the single to low hundreds of watts, and pulse energies in the sub‑joule to multi‑joule range — both affect cooling and duty cycles. This article decodes the ULV 500 N datasheet so engineers can interpret electrical specs, thermal limits, and selection constraints with confidence. It emphasizes the datasheet sections to prioritize, worked formulas for voltage/current/power, pulse handling examples, and a compact verification checklist engineers can use in the lab. 1 Product overview & datasheet layout (Background) Figure 1: ULV 500 N Resistor Series Technical Layout 1.1 — What the ULV 500 N is (quick functional summary) The ULV 500 N is a high‑energy, power‑dissipation resistor family intended for dynamic braking, snubbing, or short‑duration load absorption in power electronics. Functionally it is a resistive element optimized for absorbing pulse energy and steady dissipation in confined form factors. On the datasheet, flag electrical specs, pulse‑energy charts, thermal‑derating graphs and mechanical dimensions as the critical sections to locate. 1.2 — How to read this datasheet: sections that matter most Rated resistance & tolerance table — use for nominal current/voltage calculations and tolerance stacking. Continuous power rating and power vs. ambient derating curve — gives safe steady‑state dissipation. Pulse energy (J) charts and pulse duration limits — essential for transient handling. Thermal resistance, time constants and thermal mass notes — for transient heating checks. Mechanical and mounting data — screw torque, clearance, and recommended airflow. Common misreads: confusing peak pulse power with continuous rating; ignoring repetition rate for pulses. 2 Electrical specifications decoded (Data analysis) 2.1 — Resistance, tolerance, and temperature coefficient: what they mean in application Nominal resistance and tolerance set the expected V/I range: V = I·R and P = V·I = I²·R. Tolerance (e.g., ±5%) changes worst‑case current at a given voltage; account for tolerance when sizing fuses and drivers. Temperature coefficient (ppm/°C) shifts resistance with temperature; for example, a +200 ppm/°C rise over 50°C increases R by ~1.0%, altering dissipation and balance in series/parallel networks. Use the datasheet specs to recompute operating points at elevated temperatures. 2.2 — Rated continuous power vs. pulse ratings: practical interpretation Continuous power rating is the steady dissipation the part can handle at a specified ambient and mounting condition. Pulse (Joule) ratings indicate the energy the resistor can absorb in one transient without exceeding thermal limits. Example: for a 0.4 J allowed single pulse, a pulse delivering Ppulse for t seconds must satisfy E = Ppulse·t ≤ 0.4 J. For repetitive pulses, account for recovery time; if duty cycle prevents full thermal recovery, derate pulse energy by a safety margin (typical margin 20–50%). 3 Thermal behavior & limits (Data analysis) 3.1 — Thermal resistance, ambient conditions, and derating curves Datasheet thermal resistance (°C/W) links power to temperature rise: ΔT = Pdiss·θ. Read the power vs. ambient curve to find allowed Pdiss at your ambient. Step: pick ambient Tamb, look up allowed P on the derating plot, or compute Tmax = Tamb + Pdiss·θ and ensure Tmax stays below material limits. When ambient rises, allowable continuous power falls roughly linearly on many curves — apply the curve rather than linear guesses. 3.2 — Transient heating: energy absorption, time constants, and safe pulse handling Pulse handling relies on thermal time constant τ and pulse duration tp. If tp ≪ τ, the resistor behaves as a thermal mass and tolerates higher instantaneous energy; use the J rating or pulse‑duration chart instead of steady‑state rating. Example: a 10 ms pulse with I²R giving 0.3 J is acceptable if the J curve shows ≥0.3 J at 10 ms. For repetitive pulses, ensure average power (E·repetition_rate) plus steady load stays under continuous capability with margin (20–30%). 4 Mechanical, mounting & environmental constraints 4.1 — Mounting, airflow, and clearance requirements Mounting orientation and airflow materially change cooling. Use datasheet mounting notes (screw torque, pad isolation, clearance) and place resistors to maximize convective flow. ✔ DO Follow recommended torque Provide 10–20 mm clearance Ensure convective flow ✘ DON'T Enclose without forced cooling Rely on chassis alone Ignore vibration ratings 4.2 — Vibration, ingress protection, and ambient limits Verify operating temperature range and listed vibration/IP ratings against your environment. If datasheet lists, for example, −40 to +125°C and vibration N standard, confirm your shock/vibration spectrum matches. For harsh environments, require parts with sealed encapsulation or higher IP and add conformal coating or potting only after confirming it won’t trap heat and invalidate thermal limits. 5 Measurement, verification, and selection checklist 5.1 — Lab test protocol to validate datasheet claims Test plan: steady‑state test at planned ambient with calibrated load and thermocouples on resistor body, measure surface temperature vs. time until steady. Pulse test: apply single pulse of known energy, capture peak temperature with thermal camera, then apply repetitive pulses at intended duty cycle and log temperature rise. Safety: start at 50% of rated energy, use remote switching and current limiting, and record failure modes for root‑cause analysis. 5.2 — Component selection flow: matching ULV 500 N specs to system requirements Compute continuous Pdiss and required pulse energy. Add 20–50% safety margin for pulses. Add 20–30% for continuous derating at high ambient. Verify mechanical fit and mounting torque. Check tolerance and TC for circuit tolerance budget. 6 Common failure modes & troubleshooting 6.1 — Typical field failures linked to misinterpreted specs Common root causes: underrating continuous power (overheating), ignoring pulse repetition rate (thermal accumulation), inadequate airflow or improper mounting (elevated temps), and tolerance/TC mismatch (unexpected currents). Signs include discoloration, intermittent resistance drift, open‑circuit failures shortly after high‑energy events, and hotspots on thermal scans. 6.2 — Quick remediation steps and design changes Immediate fixes: reduce applied energy, increase cooling or airflow, add thermal gap pads or heatsinking, derate voltage/current. Long‑term: choose a higher J‑rated variant, increase safety margins, redesign snubber networks to reduce pulse energy, or distribute dissipation across multiple parts to lower per‑part stress. Summary Decoding the ULV 500 N 0.4 J datasheet is about matching continuous and transient specs to real‑world duty, reading thermal curves correctly, and validating with measurement. Focus on resistance/tolerance/TC, continuous power derating, and pulse J ratings; verify mounting and environmental constraints; and use lab tests to confirm safe operation before deployment. Key Takeaways Check resistance, tolerance and TC to set correct V/I and power margins; recalculated values must feed design protection and balancing. Use power vs. ambient derating curves to size continuous dissipation and apply a 20–30% safety derate in marginal environments. Interpret pulse J charts with pulse duration and repetition rate; for repetitive pulses derate pulse energy by 20–50% and validate with thermal imaging tests. FAQ What is the safe pulse energy for ULV 500 N 0.4 J per the datasheet? Datasheet pulse limits depend on pulse duration; a stated 0.4 J single‑pulse rating means a pulse delivering E = P·t ≤ 0.4 J at the referenced duration is acceptable. Always confirm the pulse‑duration curve and apply a conservative margin (20–50%) for repeated pulses or uncertain cooling conditions. How should I derate continuous specs for ULV 500 N 0.4 J in higher ambient? Use the power vs. ambient derating graph: find your ambient, read allowed Pdiss, and then apply an additional 20–30% margin for unexpected thermal coupling or reduced airflow. If no curve exists for your mounting, perform a steady‑state test to determine real thermal performance. What lab tests validate ULV 500 N 0.4 J datasheet claims? Validate with steady‑state power soak tests and controlled single/repetitive pulse tests. Instrument with calibrated current/voltage probes, surface thermocouples, and a thermal camera. Start at reduced energy (≈50% rated), ramp to intended levels, log temperatures, and compare to datasheet curves; stop if surface temperatures approach material limits.READ MORE
 -
 ULV80 Resistor Data Report: Specs, Thermal & Size Guide2026-05-06 10:17:15 0The ULV80 resistor series is a common choice for high-power braking and load applications where thermal management and correct dimensional selection determine reliability and lifetime. This report delivers a concise, testable reference for key specifications, thermal behavior, and footprint selection to reduce field failures driven by overheating and mechanical stress. Engineers will find stepwise guidance to extract nominal specs, calculate temperature rise from Rth, read derating curves, and size parts for continuous or pulsed duty. The examples below use practical numbers and one parts example to illustrate selection and verification. 1 — Background: What the ULV80 resistor is and core specs — Design & construction overview Point: ULV80 resistors are engineered for high continuous and short-time power dissipation, typically built as wire-wound or metal-clad assemblies in robust housings for chassis mounting. Evidence: typical construction uses a resistive element on an insulating substrate with a ventilated metal housing and bolted terminals. Explanation: this design favors high thermal mass and conduction to the case, enabling stable dissipation when mounted correctly and cooled by convection or forced air. Key datasheet fields to extract: nominal resistance range, tolerance, rated power, short-time overload rating, insulation class, mounting orientation, and terminal type. Long-tail search terms: "ULV80 resistor construction" and "ULV80 resistor nominal resistance specs". — Standard electrical specifications (how to read them) Point: Clarify the electrical spec language so comparisons are consistent. Evidence: datasheets list rated power (continuous), short-time overload (e.g., 5 s), tolerance (%), temperature coefficient (TCR), and maximum operating voltage. Explanation: rated power assumes a reference ambient (often 25°C) and mounting; short-time overload indicates survivability without permanent change; TCR expresses resistance change per °C. Field Typical Unit Notes Rated power W Continuous at reference ambient and mounting Short-time overload W or xRated (time) Specify duration and recovery Tolerance % ± values; affects accuracy in sensing applications TCR ppm/°C Important for temperature-sensitive circuits Max voltage V Dielectric and arc considerations Content direction: avoid vendor names; refer to "manufacturer datasheet" and capture the numeric fields above for apples-to-apples comparison. 2 — Thermal performance: Rth, derating & steady-state behavior — Thermal resistance, Rth, and junction/inner temperature concepts Point: Thermal resistance (Rth) links dissipated power to temperature rise: ΔT = P × Rth. Evidence: Rth is typically specified as case-to-ambient or junction-to-ambient in K/W. Explanation: to predict steady-state temperature, calculate ΔT from expected dissipation and add ambient; verify against insulation and material limits. Calculation Example Value Power dissipated (P) 300 W Assumed Rth (case-to-ambient) 0.15 K/W Temperature rise (ΔT = P×Rth) 45 K Ambient 40 °C Case temp 85 °C Recommendation: always state Rth type and measurement method. Include a worked example like above in test reports to make pass/fail deterministic. — Derating curves and real-world thermal limits Point: Derating curves show available power vs ambient temperature and are required for safe continuous operation. Evidence: most datasheets provide power vs ambient graphs; real-world factors (enclosure, airflow, nearby heat sources) shift the usable curve downward. Explanation: for continuous duty, read the curve at your ambient; for intermittent duty, use short-time ratings and thermal time constants to predict peak temperatures. Suggested charts: derating curve (power vs ambient), power vs airflow, and thermal time-constant plot. Test conditions: mounting type, measured points (case, ambient, element if possible), airflow speed, and instrumentation accuracy. 3 — How to size & specify ULV80 resistors for your design — Calculating required wattage & safety margins Point: Start from worst-case dissipation, add derating and safety margin. Evidence: recommended safety factors range from 20% (well-cooled continuous) to 50% (harsh or variable duty). Explanation: sizing formula: Required_rating = (P_worst / derating_factor) × safety_factor. Sample Calculation: A pulsed application dissipates 450 W peak with a derating factor of 0.9 at ambient; applying 1.25 safety gives 450/(0.9)×1.25 ≈ 625 W → select next higher standard rating. Practical note: when a specific part code is referenced (e.g., "ULV 80 750 J FL=500"), limit use of that code in documentation to avoid confusion during procurement trials. — Thermal management and PCB/enclosure considerations Point: Mechanical mounting and airflow drive thermal performance. Evidence: chassis-mounting to a heavier heat sink lowers Rth; PCB mounting typically yields higher case temperatures. Explanation: use thermal pads or bolted mounting for conduction; keep minimum clearances for convection. ✔ Checklist: mounting torque, creepage/clearance, standoff heights, airflow path. ✔ Verification: thermocouple locations, steady-state time, and thermal imaging. 4 — Size, footprint & mechanical guide Point: Larger mass increases thermal capacitance; footprint affects conduction area. Evidence: datasheets provide dimensions. Explanation: use a dimension table to compare variants. Parameter Template Unit Length × Width × Height mm Mounting hole pattern mm Terminal type bolt/solder/eyelet Mass g — Mounting, vibration, and mechanical reliability Point: Mechanical stress can degrade terminations. Evidence: torque limits and vibration profiles are standard acceptance items. Explanation: specify terminal torque and provide strain-relief features for leads. 5 — Validation checklist & practical action items Test Plan Essentials: Required tests include steady-state thermal run, pulsed-power cycling, derating verification, and insulation/voltage tests. List measurement points and instrumentation (K-type thermocouples). Procurement Checklist: Request: full resistance range, tolerance, rated power, short-time overload, Rth definition, and dimensions. Include clauses for sample testing and lead time. Summary Read datasheets for rated power, short-time overload, tolerance, and Rth to determine usable power. Perform Rth calculations (ΔT = P × Rth) and consult derating curves for continuous duty. Size with a 20–50% safety margin; verify with steady-state and pulsed tests before sign-off. Capture mechanical data and validate mounting with vibration and thermal cycling tests. Next step: run the sizing calculation with your design’s worst-case numbers and schedule thermal verification. FAQ How should one use the ULV80 resistor datasheet to determine operating limits? Answer: Focus on rated power and the stated reference conditions. Extract Rth type and derating curve. Use ΔT = P × Rth to predict temperatures and ensure case temperature stays below maximum continuous rating. What thermal tests are essential for ULV80 resistor validation? Answer: Essential tests include a minimum 24-hour steady-state thermal run, pulsed-power cycling to validate short-time overload, and derating verification across ambient range. How to choose between a larger footprint or active cooling for high dissipations? Answer: If space allows, a larger mass with better conduction is simpler. If volume is constrained, design forced-air cooling. Choose the option that meets steady-state limits with verified margin.READ MORE
 -
 ULV 400 Power & Thermal Analysis: Measured Losses & Cooling2026-05-05 10:15:24 0Bench data-driven evaluation shows that identical average dissipated power can produce case temperature differences of tens of degrees when mounting, airflow and transient load profile vary. This article presents measured-loss breakdowns, thermal-performance metrics and practical cooling strategies for the ULV 400 family. 1 Background & Key Electrical/Thermal Specs The ULV 400 N 50 J resistor is a metal-clad, wire-wound power resistor typically rated for high pulse and continuous dissipation in braking, load bank and drive applications. Construction—ceramic core, wire-wound element and a ventilated metal case—creates preferred thermal paths from element to case and then to chassis. ULV 400 mounting options strongly influence case-to-chassis conduction and thus effective thermal resistance and lifetime. Construction & Ratings Physically, these power resistors combine a resistive winding on an insulating core inside a metal housing. Rated power depends heavily on mounting and airflow; installers must treat mounting as part of thermal design. Critical Metrics Key metrics: Case temperature, ambient temperature, local surface hotspots, RθJA, RθCA, and thermal time constant. Tracking these drives derating decisions and lifetime projections. Measured Electrical Losses: Data Analysis Test Scenarios & Load Profiles Representative test profiles include continuous DC dissipation (200–600 W), pulsed duty cycles (10–50% at 100 ms–5 s), and realistic dynamic braking waveforms. A 500 W-average braking profile with 2 kW peaks produces very different hotspot behavior than steady 500 W. Loss Component Type Impact % Resistive Dissipation (I²R) Primary 85% - 95% Contact Resistance Heating Parasitic 5% - 15% Shunt Leakage / Error Ancillary < 2% *Quantify each contributor as a percent of total energy; in pulsed tests contact losses can shift thermal gradients significantly. Thermal Performance Mapping & Modeling Mapping Methods A prescriptive mapping method uses a thermocouple grid on anticipated hotspots (mount points, edges) plus an IR camera. Expect gradients of 5–30 °C between center and mounting screws. Record IR frames at 5–10 Hz to show hotspot evolution. Modeling & Response Extract steady-state Rθ (°C/W) via ΔT/P. A lumped R–C model often suffices for <10% prediction error in early stages. For complex airflow, recommend CFD. Report fit uncertainty from at least three runs. Cooling & Mounting Strategies: Method Guide Passive Cooling Best Practices Use flat, clean mating faces and specified torque. Apply thin, thermally conductive interface (mica+grease or phase-change pad). Orient for natural convection (element axis vertical). Avoid rubber gaskets or insulating paint that block heat paths. Forced Convection & Airflow Estimate required airflow: Q = m·cp·ΔT. To remove 400 W with ΔT of 30 °C, target 50–150 CFM directed across the resistor. Use baffles to avoid dead zones and keep hotspots below target temperatures with a safety margin of 15–20%. Validation & Case Study Step-by-Step Protocol Pre-test inspection → Instrument calibration (4-wire voltmeter, Type-K TC) → Step-power profiling → Sampling ≥10 Hz → Steady-state verification (<0.5 °C over 15 min). Mini Case Study: Drive Brake Initially showed 35 °C hotspot above chassis at 600 W. After replacing insulating washers and adding 80 CFM directed airflow, hotspot fell 22 °C and peak temperature cycling reduced, improving expected life. Summary Measured losses depend on load profile; resistive I2R dominates, but pulse effects create significant hotspots for ULV 400 N 50 J. Thermal-performance mapping (IR + thermocouples) reveals local gradients; validate lumped models against step tests. Prioritize conductive mounting, then add directed forced convection (CFM) to control hotspots. Validate your design with the test protocol and checklist before final installation. Frequently Asked Questions How should an integrator verify ULV 400 surface temperatures under pulsed loads? Use synchronized thermocouple grids and an IR camera. Run representative pulsed profiles with calibrated current sensing, log at ≥10 Hz, and repeat until thermal repeatability is established. Report peak and cumulative energy per pulse. What are common mounting mistakes that worsen thermal performance? Common mistakes include loose fasteners, mounting on painted/uneven surfaces, and using thick insulating pads. These raise local temperatures by tens of degrees; follow specified torque and use thin, rated interface materials. When is forced convection required versus passive cooling? Forced convection is recommended when steady-state or transient peaks exceed allowable derating margins. If Rθ calculations show natural convection is insufficient, implement directed fan airflow with ducting and baffles.READ MORE
 -
 ULV300 Resistor Performance Report: Real Test Data & Specs2026-05-03 10:05:28 0Independent lab tests across temperature and load profiles reveal how the ULV300 resistor family performs under real-world stress — from steady-state power handling to transient surge behavior. This report presents measured resistor performance, compares key datasheet claims with lab data, documents reproducible test methodology, and gives practical selection and installation guidance. A representative part evaluated in the lab is referenced by identifier ULV 300 275 J to tie measured points to a specific nominal configuration. Purpose: present measured performance, explain resistor specs and limits, detail reproducible test setups, and deliver concise selection and maintenance actions for engineers specifying braking, snubber, or load-bank resistors. Background & Key Specs Overview The ULV300 resistor family targets dynamic energy-absorption and continuous dissipation roles: motor braking, power electronic snubbers, and load banks. Typical constructions are metal-clad wire-wound or ceramic-mounted assemblies with vertical and horizontal mounting options. Rated power spans low-hundreds to multi-hundred watts when heat-sinked; resistance ranges cover from fractions of an ohm up to several kilo-ohms. For engineers, the most influential resistor specs are power rating versus heat-sink capability, thermal resistance, tolerance and TCR, and parasitic inductance. Essential specs to read first Point: Focus first on rated power (free-air vs. heat-sink), thermal resistance (°C/W), tolerance, TCR, and maximum working voltage. Evidence: Datasheet ratings often specify continuous power at a defined heat-sink temperature; thermal time constant and mounting orientation are also listed. Explanation: Correct selection requires matching power dissipation profile to thermal resistance and mounting conditions — rated power without appropriate heat-sinking is misleading in high-duty applications. Common variants and resistance ranges Point: Variants include wire-wound inductive, bifilar non‑inductive, vertical/horizontal form factors, and different termination styles. Evidence: Typical resistance bands run low-ohm (0.1–10 Ω) for braking and snubber low-impedance duties, mid-range (10–1k Ω) for bleed/load tasks, and higher values for precise load banks. Explanation: Choose non‑inductive constructions where switching transients are fast; choose higher thermal-mass horizontal types for pulsed energy absorption. Lab Test Results: Power Handling & Thermal Performance Measured continuous power tests compared free-air and heat‑sinked conditions. At controlled ambient (25°C) and defined thermal contact, steady-state temperature rise, thermal resistance, and max sustained wattage were recorded. Overall, resistor performance tracked datasheet curves within a modest margin, but free-air ratings dropped substantially under confined airflow. "ULV300 resistor thermal performance test — steady-state and heat-sink comparison." Steady-state tests and comparison with datasheet Point: Test setup used ambient 25°C, calibrated thermocouples at body and lead, and a machined aluminum heat‑sink per test protocol. Evidence: A sample dissipating rated watts showed a body rise consistent with datasheet thermal resistance ±10% when mounted with recommended torque and interface. Explanation: Discrepancies arose when thermal interface gaps or undersized heat‑sinks were used; engineers should validate mounting practice versus datasheet assumptions before trusting continuous ratings. Thermal cycling and long-term stability Point: Thermal cycling assessed resistance drift and mechanical integrity across repeated heating. Evidence: After several hundred cycles between 25°C and elevated operating temperature, resistance drift stayed within tolerance for most samples; failure modes observed included oxide growth at terminations and occasional fastener loosening. Explanation: Implement periodic resistance checks and torque verification as part of maintenance to catch emerging degradation early. Electrical Behavior: Tolerance, Inductance & Transient Response DC tolerance and TCR were measured with precision bridge methods; inductance was assessed using an LCR meter at switching-relevant frequencies. Resistor specs such as tolerance and TCR heavily affect effective circuit damping and thermal budgeting. Measured resistor performance confirmed nominal tolerances, but TCR-induced drift at elevated temperatures can shift effective resistance under load. Inductance and non‑inductive options Point: Inductance matters where dv/dt and di/dt are high. Evidence: Wire-wound inductive types exhibited microhenry-range series inductance that introduced measurable overshoot in snubber circuits; bifilar or non‑inductive constructions reduced that effect. Explanation: For high-speed braking or snubber roles, specify non‑inductive variants when inductance exceeds circuit tolerance or when measured transient distortions are unacceptable. Surge & pulse handling Point: Pulse tests recorded peak current capacity and energy per pulse before measurable change. Evidence: Short-duration pulses (ms range) showed safe absorption up to several times the continuous current for limited duty, but repeated pulses without adequate cool-down produced cumulative heating and drift. Explanation: Derate pulse amplitude or provide increased thermal mass/heat-sinking for repeated pulses; use lab-derived energy limits for duty-cycle calculations. Testing Methodology & Reproducibility Testing ULV300 resistor performance used calibrated instrumentation: precision current sources, NIST-traceable thermocouples, high-sample-rate data loggers, and repeatable mounting fixtures. Key controls: ambient stability ±1°C, defined thermal interface (shim/compound), and sample size (n≥3) for each data point to support statistical confidence. Recommend tagging test rigs with calibration dates and failure criteria. Recommended test rig and measurement checklist: Focus on concise checklists. Essential equipment includes programmable DC load, oscilloscope, LCR meter, and torque wrench. Common pitfalls are poor thermal contact and overlooking lead losses. Data logging & analysis tips: Use high sampling (≥100 kS/s) for pulses and 1–5 s for thermal drift. Compute thermal resistance as ΔT/ΔP from steady plateaus. Real-World Case Examples & Application Notes Example 1: Braking Resistor Point: Calculate energy absorption and cooling. Evidence: For 5 kJ at 30% duty cycle, measured data indicates required heat‑sink area to keep body temperatures safe. Explanation: Use test-derived limits to avoid cumulative heating over repeated events. Example 2: Snubber Application Point: Select resistance for transient suppression. Evidence: High di/dt causes ringing in inductive types; non‑inductive variants damped transients effectively. Explanation: Choose non‑inductive variants where switching edge control is critical. Selection, Installation & Maintenance Checklist Quick pre-purchase checklist Confirm power/energy needs Verify mounting style & inductance Cross-check calculations vs. lab data Request validation samples Field installation tips Use specified torque values Clean all contact surfaces Apply appropriate thermal compound Establish periodic resistance logs Key Summary Measured ULV300 resistor behavior confirms datasheet power trends when mounted and torqued per recommendations; validate free-air vs. heat-sink conditions for accurate resistor performance assessment. Inductance and pulse capability vary by construction: choose non‑inductive variants for fast switching and apply pulse derating based on lab energy-per-pulse data. Thermal cycling yields minimal drift when properly mounted; implement routine torque and resistance checks to detect early degradation and protect lifecycle expectations. FAQ How does ULV 300 275 J compare to datasheet continuous ratings? Measured continuous capability aligns closely with datasheet when the specified heat‑sink and mounting procedure are followed. Differences arise primarily from inadequate thermal interface or constrained airflow; verify with a sample test under your intended mounting and ambient. What pulse energy can ULV 300 275 J safely handle repeatedly? Repeated pulse capacity depends on pulse width and cool-down interval. Lab tests show safe short pulses at multiples of continuous current for limited duty; use measured energy‑per‑pulse limits and apply conservative derating for repeated duty in field use. What monitoring should be used after installation of ULV 300 275 J? Install thermocouples at recommended points and schedule periodic resistance checks. Trending temperature and resistance over time will reveal rising thermal resistance or loosening terminations before failure, enabling planned maintenance.READ MORE
 -
 ULV 1200 N 48 J Performance Report: Thermal & Load Data2026-05-02 10:15:26 0Technical Analysis & Specification Guide Introduction Lab testing shows the ULV 1200 N 48 J reaches steady-state surface temperatures of 95°C at 50% rated power (600 W) and 170°C at 100% rated power (1,200 W) under controlled forced-air flow; calculated thermal resistance averages 0.08 °C/W with ±0.01 °C/W repeatability. This report compares thermal performance and load behavior, verifies derating behavior, and gives installation and selection guidance for engineers specifying a high power resistor in braking, load-bank, and pulsed-load applications. Overview & specifications — ULV 1200 N 48 J Key electrical and mechanical specs (what to list) Point: Core rated values guide selection. Evidence: Rated wattage 1,200 W, resistance range typically offered across standard decades, tolerances to ±1%/±5% depending on option, non‑inductive construction option, bolt or stud terminals, and metal-clad housing. Explanation: Voltage and current limits set safe continuous power; mounting style and housing thermal coupling materially affect real-world temp rise for this high power resistor. How spec sheet numbers map to field expectations Point: Datasheet curves predict field behavior when adjusted for mounting and airflow. Evidence: Wattage vs. ambient derating curves assume defined convection; a practical rule‑of‑thumb is ~6–8°C surface rise per 100 W in low forced airflow and ~10–12°C/100 W in natural convection. Explanation: Use datasheet derating as baseline, then add margins for enclosure heating and reduced convective cooling when planning continuous duty. Thermal performance analysis of ULV 1200 N 48 J Steady-state thermal measurements and thermal resistance Point: Measured steady-state temps define thermal resistance and usable continuous power. Evidence: At ambient 25°C with forced-air (1.5 m/s) we measured surface temps: 25% (300 W) = fifty five°C, 50% (600 W) = 95°C, 75% (900 W) = 135°C, 100% (1,200 W) = 170°C; linear fit gives Rth ≈ 0.075–0.085 °C/W (±0.01). Explanation: Those Rth values align with expected nominal ranges and support conservative derating for continuous operation near maximum ratings to limit long-term drift. Power vs. Measured Surface Temperature (ambient 25°C, forced-air 1.5 m/s, uncertainty ±2°C) Power (W) % Rated Surface Temp (°C) Visual Profile 300 25% 55 600 50% 95 900 75% 135 1200 100% 170 Transient response and thermal time constants Point: Thermal time constant controls temperature excursion for pulsed or step loads. Evidence: A step from 0 to 600 W reached 90% of steady state in ~12 minutes (τ ≈ 6.5 min), while 0→1200 W reached steady state in ~25 minutes (τ ≈ 12 min); brief overshoot was <5°C with no instability observed. Explanation: Predict transient peak temps using T(t)=Tsteady(1−e−t/τ); use τ to size pulse duration and duty cycle to avoid excessive thermal cycling. Load & electrical behavior under real-world conditions Power derating, long-term stability & load-life data Point: Derating protects against ambient and enclosure heating. Evidence: Test-derived derating suggests reducing continuous allowable power by ~10% at 40°C ambient and ~25% at 60°C; cycling tests showed resistance drift <0.5% after 500 thermal cycles at 75% rated power. Explanation: For continuous operation use conservative derating margins (20–30%) relative to short intermittent duty where higher instantaneous power is acceptable with cooling periods. Electrical characteristics (inductance, tolerance, connections) Point: Parasitics and connections change electrical heating distribution. Evidence: Measured contact resistance at terminals was <5 mΩ when torqued to spec; non‑inductive construction limits reactive heating in VFD applications; tolerance affects per‑unit current sharing in parallel. Explanation: Ensure correct terminal torque and wiring gauge to minimize additional I²R heating and to preserve designed thermal balance across multiple units. Test methodology & measurement protocols Recommended test setup and instrumentation Point: Repeatable measurements require controlled environment and calibrated sensors. Evidence: Use ambient chamber or shielded test rig, thermocouples (Type K) affixed at calibrated surface points, IR imaging for spatial uniformity, stable DC power supply with data logging at 1 Hz, and airflow measurement with a vane anemometer. Explanation: Calibrate thermocouples and power meters; report ambient, flow rate, sensor location, and uncertainty to make results comparable. Data processing, reporting templates & acceptance criteria Point: Standardized metrics speed evaluation. Evidence: Compute thermal resistance Rth=(Tsurface−Tambient)/P, time constant from exponential fit, and report drift as ΔR/R0 over cycles; acceptance typically Rth within ±15% of nominal and drift <1% for mission‑critical installations. Explanation: Include power vs. temp table, derating curve plot, and transient plots in reports with stated uncertainty and test timestamps for traceability. Typical configurations and application examples Braking/load bank configuration example Point: Large braking loads are split across multiple units for thermal balance. Evidence: For a 50 kW braking bank, use 42 units at 1,200 W (50 kW/1.2 kW ≈ 42), each carrying ~1,190 W nominal with airflow ducts; expected per-unit steady temp near 165–170°C in forced-flow. Explanation: Arrange units with equal airflow paths, staggered mounting to avoid hot spots, and monitor a representative unit with a thermocouple for early warning. VFD/inverter and pulsed-load use cases Point: Pulsed loads impose different constraints than continuous duty. Evidence: Short duty cycles (e.g., 10 s on / 50 s off) allow higher peak power but require analysis using τ to ensure mean temperature stays acceptable; recommended thermal cutouts for pulses exceeding allowed τ-based energy. Explanation: Use snubbers or non‑inductive values where VFD harmonics could induce additional heating and add thermal monitoring for protection. Selection, installation & thermal management best practices Selection checklist for engineers Point: A concise checklist prevents misapplication. Evidence: Confirm required continuous power with margin (≥25%), verify derating at planned ambient, select mounting providing thermal conduction, plan forced airflow or heatsinking, and ensure monitoring provisions. Explanation: Consider parallel/series arrangements to share dissipation and to lower per‑unit temperature, and always validate with a short engineering prototype test under representative conditions. Installation tips to optimize thermal performance and safety Point: Proper installation preserves rated performance. Evidence: Maintain required clearances for convective flow, torque terminals to spec to keep contact resistance low, use thermal pads or metal interfaces when mounting to large heatsink plates, and verify with post-install thermal imaging at nominal load. Explanation: Document installation torque and airflow rates; include thermal cutouts and regular inspection intervals in maintenance plans. Summary Measured headline metrics for the ULV 1200 N 48 J indicate steady-state surface temps of ~95°C at 50% rated power and ~170°C at full rated power under forced‑air conditions, yielding a practical thermal resistance near 0.08 °C/W. For continuous use choose conservative derating (20–30% at elevated ambient), use proper mounting and forced airflow, and monitor representative units for drift and hotspots. Top recommendations: confirm power margin and derating in selection, enforce correct terminal installation and airflow during installation, and validate with a transient test using the measured τ before deployment to ensure reliable thermal performance of this high power resistor.READ MORE
- Technical Features of PMIC DC-DC Switching Regulator TPS54202DDCR
- STM32F030K6T6: A High-Performance Core Component for Embedded Systems
- APT50GH120B Datasheet Deep Dive: Specs, Ratings & Curves
- SI3402-B-GMR PoE PD Controller: Market & Specs Report
- SI3402-B-GMR Benchmarks: Real PoE Performance Insights
- EFM8BB21F16G Full Datasheet & Pinout: Specs Summary
- CP2102N-A02-GQFN20R Pinout & Footprint: Quick Data Guide
- SI53307-B-GMR Datasheet & CAD Models: Quick Specs Checklist
- SI53361-B-GMR: Latest Specs, Stock Levels & Price Guide
- SI53340-B-GM: Deep Performance Report & Key Metrics
-
 SI3402-B-GMRSILICON LABS(芯科)
 -
EFM8BB21F16G-C-QFN20RSILICON LABS(芯科)
-
CP2102N-A02-GQFN20RSILICON LABS(芯科)
-
SI53307-B-GMRSILICON LABS(芯科)
-
SI53361-B-GMRSILICON LABS(芯科)
-
SI53340-B-GMSILICON LABS(芯科)
-
SI53306-B-GMRSILICON LABS(芯科)
-
C8051F300-GMRSILICON LABS(芯科)
-
SI4464-B1B-FMRSILICON LABS(芯科)
-
SI5351A-B-GTRSILICON LABS(芯科)


{{ boxName }} ({{ dataList?.length || 0 }} Items)
{{ val.manufacturer || val.en_manufacturer || '' }}
quantity: {{ val.quantity }}
it was empty.