AIKQB200N75CP2AKSA1 Datasheet: Deep Specs & Performance
High-voltage, high-current power semiconductors enable compact, efficient power conversion across EV chargers, industrial inverters, and server supplies; system-level efficiency gains frequently deliver single-digit percentage improvements that translate to substantial energy and cooling savings. This article is a focused deep-dive into the AIKQB200N75CP2AKSA1 datasheet and real-world performance, showing how to read key tables, benchmark switching and thermal behavior, and apply results to design decisions.
Product overview & intended applications (background)
What this part is and where it fits
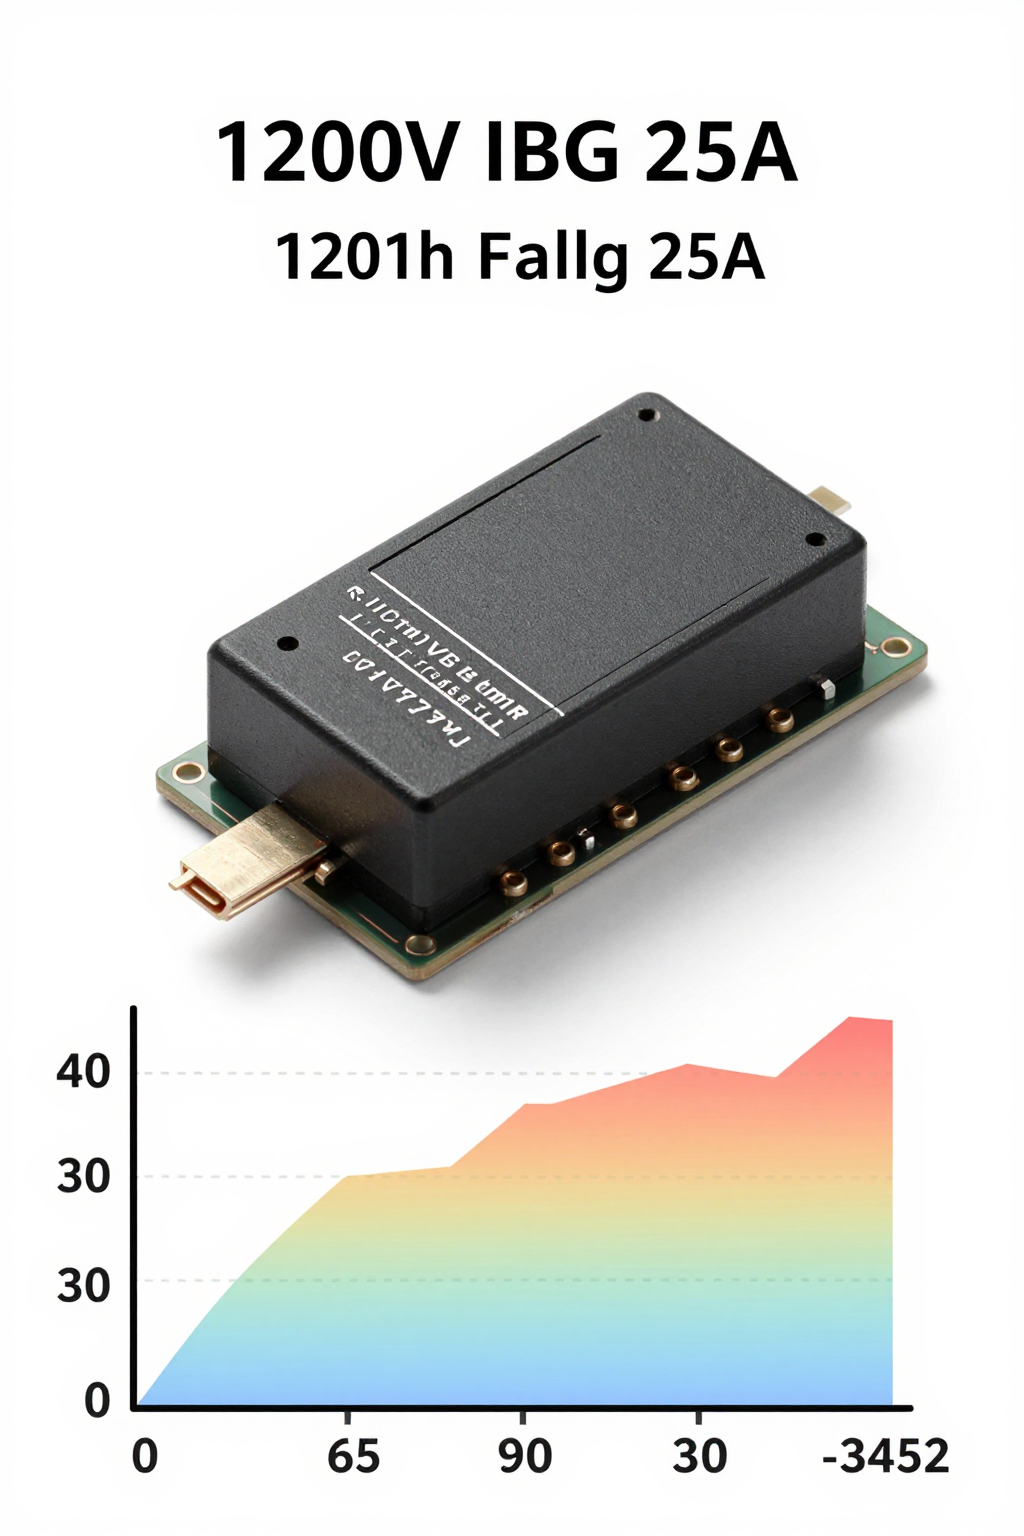
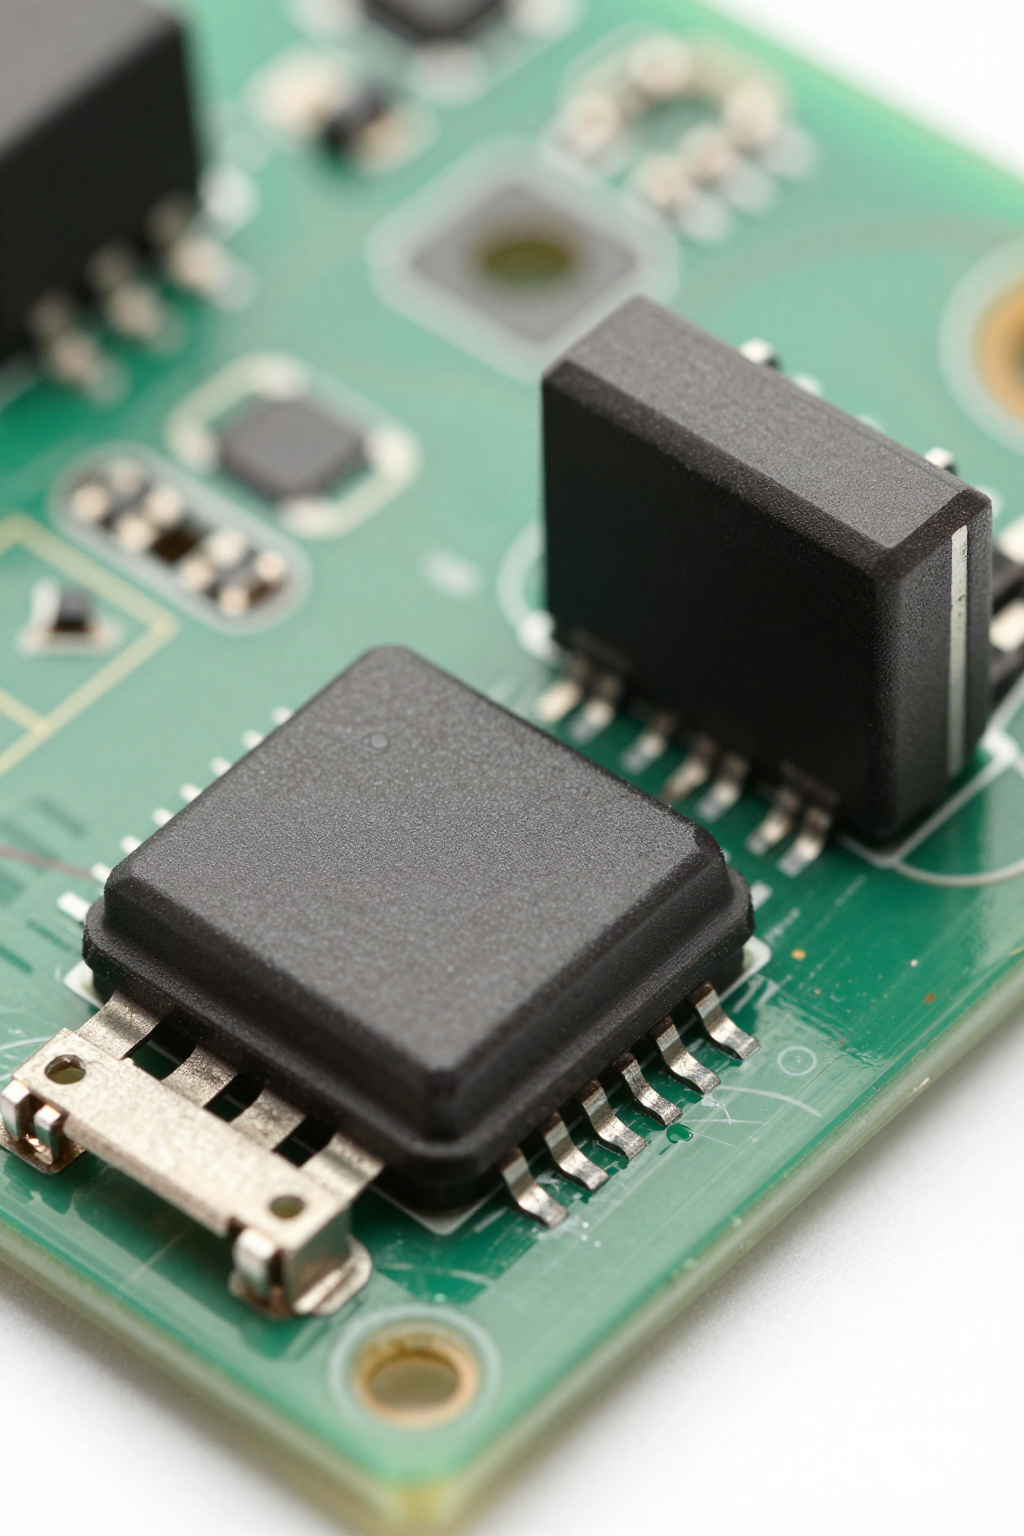
The AIKQB200N75CP2AKSA1 is a high-voltage power switch module intended for demanding power-conversion tasks. From the datasheet it classifies as a discrete power MOSFET/pressure-optimized module designed for high current density and rugged operation. Typical value propositions: lower conduction loss, integrated thermal pad for cooling, and high pulsed current capacity for hard-switching applications.
- High-power solar and grid-tied inverters
- Fast EV charger power stages
- Industrial motor drives and traction converters
- Server PSU front-end and DC-DC stages
Key identifiers & package summary
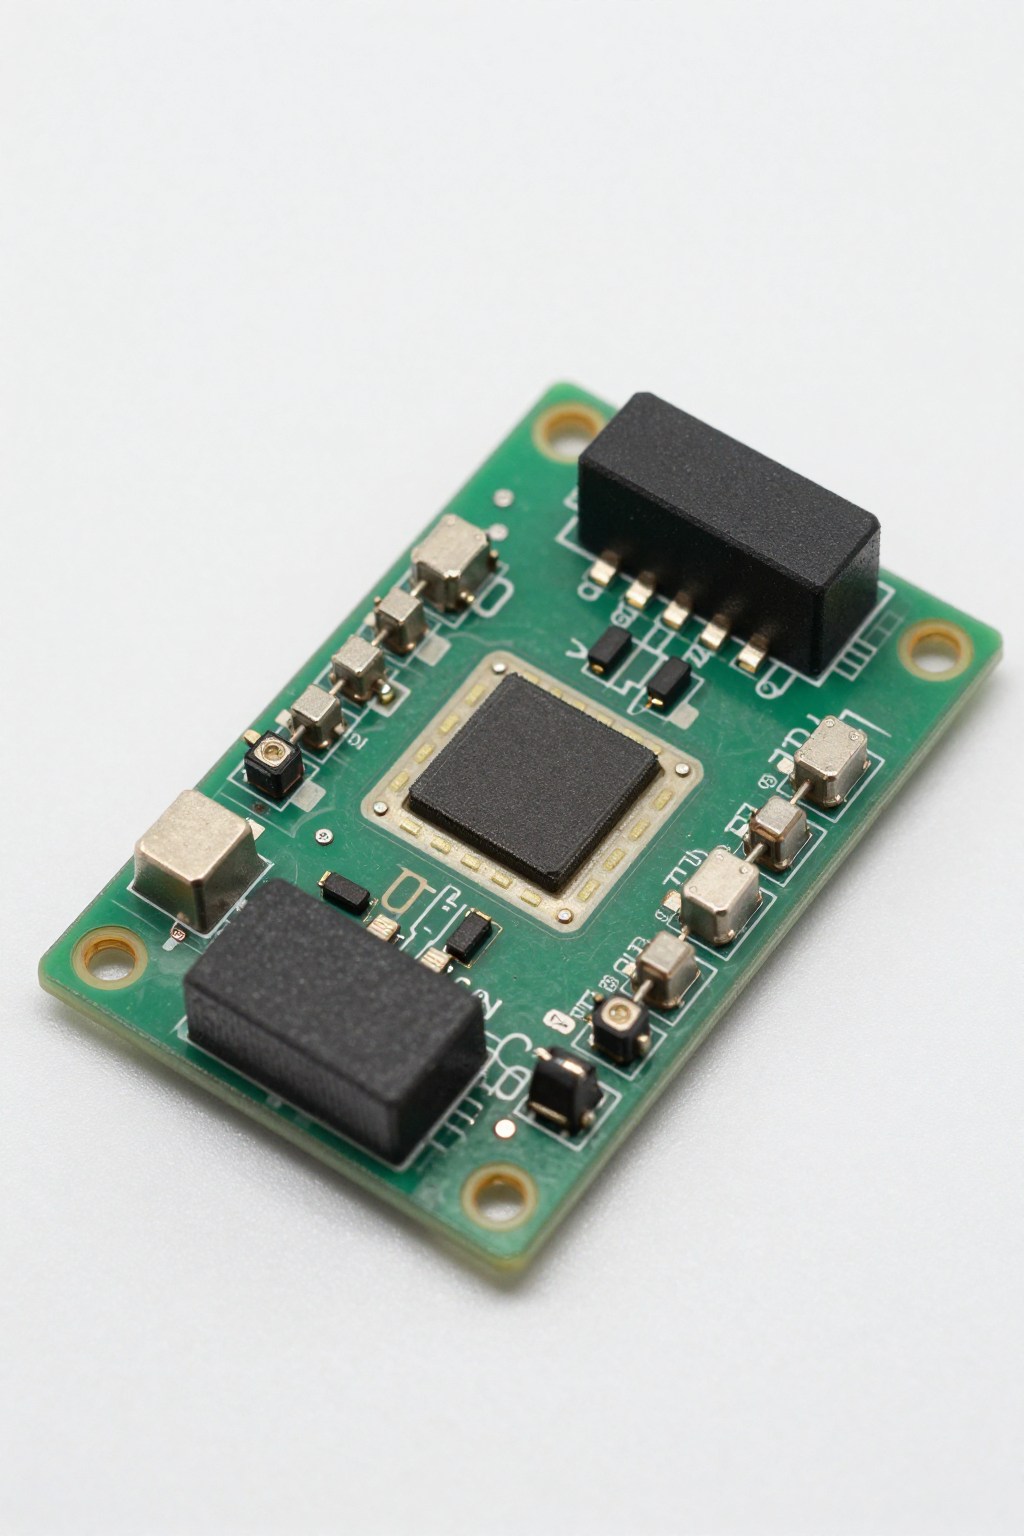
Model notes and package variants are listed in the official package drawings; consider pin-out, cooling interface, and board footprint when planning. Common deliverables include a compact module with a large thermal pad and multi-pin control pins. Include a labeled mechanical drawing during review and validate dimensions against your board keepouts.
| Package | Typical dimension | Pin-out |
|---|---|---|
| Power module (flat base) | ~30 × 22 × 6 mm | 3 power terminals + gate/aux pins |
Electrical specifications: essential parameters (data analysis)
Static electrical specs to present and explain
Key static parameters to extract: VCE/BREAKDOWN rating, continuous and pulsed current (IC), on-state voltage/drop, gate threshold (if applicable), and leakage. Always note test conditions (Ta, Tc, VGE, pulse width). For example, specify VCES test at Tc = 25°C and pulsed IC test with pulse width ≤ 1 ms to match datasheet convention.
| Parameter | Example value | Test condition |
|---|---|---|
| VDSS / VCE breakdown | ~750 V | Tc = 25°C |
| IC (continuous) | 200 A (pulsed rating higher) | Tc rated |
| RDS(on) / VCE(sat) | Low mΩ / < 2 V | Id and Vgs per table |
Dynamic and switching parameters to highlight
Capture turn-on/turn-off times, Eon/Eoff switching energies, di/dt and dv/dt capability, and reverse-recovery if an internal diode exists. Recommended test circuits are standardized: a resistive-inductive load with a snubber clamp, specified gate drive voltage, and pulse widths to avoid thermal accumulation. Plan to produce Eon vs. Ic and switching-loss vs. frequency plots from bench data.
Thermal, mechanical & reliability specs (data analysis / method)
Thermal performance and cooling guidance
Extract Rth(j‑c), Rth(c‑a), and max junction temperature. Use the standard junction-temperature formula TJ = TA + P × Rth(j‑a) for steady state or TJ = TC + P × Rth(j‑c) when TC is controlled. For a 200 A pulse dissipating 100 W average into the module, a 0.5°C/W thermal path yields a 50°C rise above the cold plate; size cooling accordingly and apply derating curves for continuous duty.
Mechanical limits, lifecycle & reliability notes
Capture vibration and thermal cycling ratings, max solder/reflow profile, storage temp, and any qualification metrics like HTOL or HTRB. These mechanical limits directly affect long-term performance: thermal cycling increases contact resistance and reduces thermal conductivity, which degrades switching and conduction performance over life—plan margin and maintenance or monitoring accordingly.
Benchmarks & real-world performance (data-driven)
Recommended test procedures & measurement setup
Define pulse vs. continuous tests, measurement nodes, clamp/snubber topology, and gate-drive conditions. A minimal test setup: isolated power supply, shunt or hall current sensor, Kelvin-sensed VCE, oscilloscope with proper probe grounding, and forced-air or cold-plate cooling. Document ambient temperature, duty cycle, and measurement bandwidth to ensure repeatability and safety.
Interpreting benchmark results and expected ranges
Translate datasheet curves to in-system expectations: estimate switching losses at target switching frequency by reading Eon/Eoff vs. Ic and scaling by switching rate; add conduction loss Id^2 × RDS(on) for average loss. Present efficiency vs. output current and temperature-rise vs. dissipated power to validate cooling and gate-drive choices. Label benchmark captions with the phrase AIKQB200N75CP2AKSA1 switching performance datasheet for traceability.
Comparative analysis & selection guidance (case / method)
How to compare this part against alternatives
Use a consistent checklist: voltage/current ratings, switching energy, thermal resistance, package footprint, cost-per-performance, and lead time. Build a comparison table template so designers can score trade-offs quickly; emphasize application-relevant axes such as peak pulsed current for traction versus low RDS(on) for conduction-dominated DC-DC stages.
Selection scenarios & trade-offs
Scenario A: high-efficiency inverter—prioritize low switching energy and low conduction loss; derate voltage and ensure superior cooling. Scenario B: rugged industrial drive—prioritize high pulsed current and robust avalanche or clamp behavior. In each case, choose conservative derating (20–30%) on current and thermal metrics to protect long-term reliability.
Design & implementation checklist (actionable guidance)
Pre-design checklist (what to verify in the datasheet)
Before selection: confirm absolute max ratings, safe operating area, thermal mounting specs, gate/drive compatibility, recommended external components such as snubbers and gate resistors, and soldering profiles. Record maximum permitted dv/dt and recommended gate resistor ranges to avoid false turn-on or oscillation under high dI/dt conditions.
PCB layout, gate drive and protection best practices
Layout tips: large thermal pad to cold plate, heavy copper pours, short loop inductance at power nodes, Kelvin gate sense where recommended, and separated return paths for power and control. Gate drive: proper drive voltage, damped gate resistors, and desaturation or active-clamp protection. Use TVS and RC snubbers as needed per switching waveform analysis.
Summary (10–15%)
This data-driven deep dive into the AIKQB200N75CP2AKSA1 datasheet synthesizes what engineers must know: top specs to monitor are voltage and current ratings, Rth and thermal mounting, and switching energy for loss estimation. The datasheet provides essential tables; combine them with bench procedures to validate real-world performance. Next steps: download the official datasheet, run the benchmark example, and apply the pre-design checklist before prototype integration.
Key summary
- Extract static ratings and test conditions from the datasheet to size the part correctly and avoid exceeding VCE and IC limits during pulse tests.
- Prioritize thermal path design: use Rth values to calculate TJ under load and ensure cold-plate or forced-air cooling meets derated continuous power.
- Benchmark with standardized pulse tests to derive switching energy and conduction loss curves for system efficiency modeling and gate-drive tuning.