MPMT2001AT5 resistor network datasheet: key specs overview
The MPMT2001AT5 is presented as a high‑precision resistor network intended for tightly matched divider and sensing applications. Evidence in common datasheet fields highlights extremely tight ratio tolerance and low tracking TCR, which drive accuracy in precision dividers and sensor front‑ends. The article explains which datasheet entries matter.
Designers evaluating the part should read resistance tables, ratio tolerance lines, TCR/tracking figures and power/voltage limits in the official datasheet and verify them on the bench; these fields determine whether the network meets system accuracy, stability and reliability requirements for precision ADC front ends and bridge sensors.
Product background & at-a-glance overview (Background introduction)
1.1 What the MPMT2001AT5 resistor network is
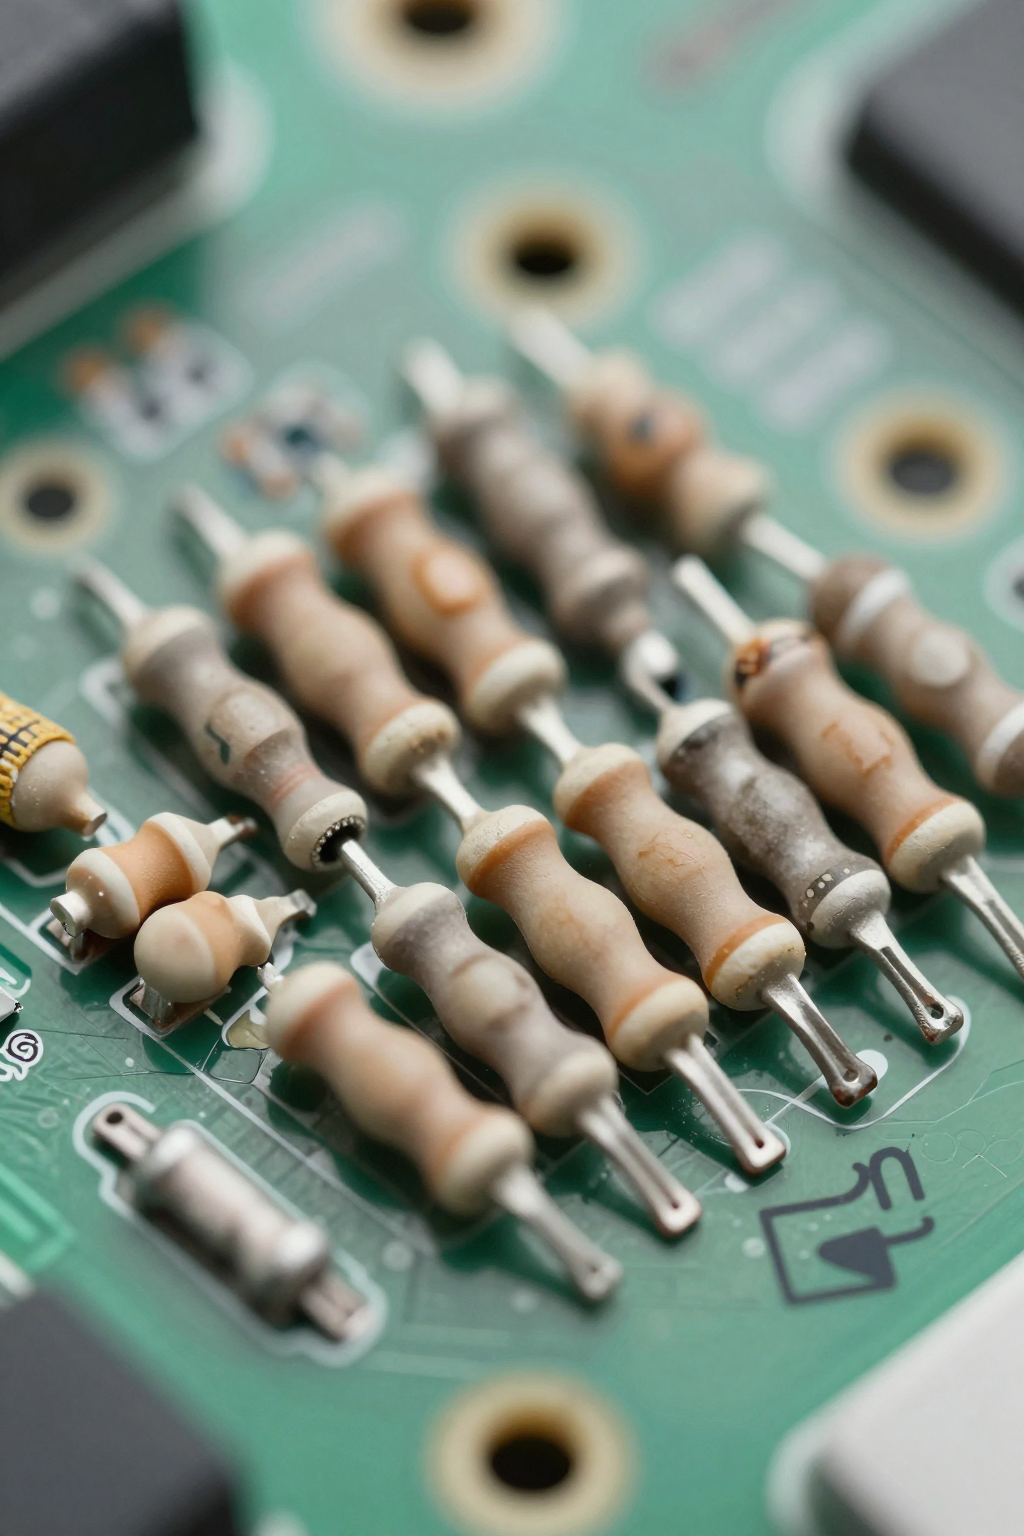
As a point, the device is a multi‑resistor network in a compact SMD package suitable for space‑constrained designs. Datasheet mechanical and schematic blocks typically show a SOT‑23‑style family outline and four‑ to six‑element topologies. In practice this topology supports isolated or ratioed elements used as precision dividers and matched resistor arrays.
1.2 Typical application scenarios and why datasheet specs matter
Point: target applications include ADC input dividers, current‑sense scaling and bridge sensor balancing. Evidence: datasheet ratio tolerance and tracking specs directly influence measurement accuracy and temperature drift. Explanation: for ADC front ends the ratio tolerance sets initial error, while TCR/tracking sets drift across operating temperature; both matter for sensor front‑end stability and precision divider performance.
Key electrical specifications to read first (Data analysis)
| Parameter | Typical Value | Impact on Design |
|---|---|---|
| Absolute Resistance Tolerance | ±0.1% | Baseline accuracy for single elements |
| Ratio Tolerance | ±0.01% | Critical for divider accuracy |
| Tracking TCR | ≤ 5 ppm/°C | Determines drift over temp range |
| Max Working Voltage | See Datasheet | Limits signal amplitude headroom |
2.1 Resistance values, absolute tolerance and ratio tolerance
Point: resistance range and tolerances determine baseline accuracy. Evidence: datasheet tables list absolute tolerance (e.g., ±0.1%) and much tighter ratio tolerance (e.g., ±0.01%). Explanation: for a 1:1 divider a ±0.01% ratio mismatch (δ=0.0001) produces roughly δ/2 ≈ 0.005% divider error, while a ±0.1% absolute tolerance can produce up to ~0.05% error if legs differ, so ratio tolerance dominates matched‑element accuracy.
2.2 Temperature behavior, tracking (TCR), and power ratings
Point: TCR and tracking define thermal stability. Evidence: datasheet lists individual element TCR (ppm/°C) and a tracking ppm/°C between elements, plus power per element and package derating. Explanation: convert tracking to drift by multiplying ppm/°C by temperature span (e.g., 5 ppm/°C × 125°C = 625 ppm ≈ 0.0625%); power ratings set maximum allowable dissipation and influence derating during solder reflow and elevated ambient operation.
Physical, package and reliability details (Data / method)
3.1 Pinout, package dimensions and PCB footprint considerations
Point: mechanical and footprint accuracy affect electrical performance. Evidence: datasheet mechanical drawings give pad sizes, pinout and recommended solder land patterns. Explanation: follow the recommended footprint for thermal balance—oversized pads can increase heat sinking and shift resistance under power; verify pinout against an existing BOM part when replacing networks to avoid swapped bussed/isolated pins.
3.2 Environmental & reliability specs: temperature, voltage, and lifecycle
Point: working voltage, humidity/temperature ratings and life tests determine field reliability. Evidence: datasheet typically shows max working voltage, short‑time overload, humidity bias tests and long‑term stability figures (ppm/year). Explanation: interpret short‑time overload as a stress indicator and compare long‑term drift to system accuracy budget; ensure max voltage exceeds expected transients and that operating temperature fits the component’s rated range.
Performance trade-offs and verification methods (Method / testing)
4.1 Circuit-level impacts: ratio vs. absolute errors, noise and parasitics
Point: matched networks reduce ratio error but layout and parasitics still limit accuracy. Evidence: datasheet ratio and parasitic resistance numbers plus recommended layout notes. Explanation: in high‑impedance dividers parasitic leakage and noise dominate; mitigate with buffer amplifiers, guard rings and tight ground practices. Use lower resistor values if noise floor allows and ensure parallel traces don’t introduce thermal gradients.
4.2 Practical bench tests to verify datasheet claims
Point: verify resistance, ratio and tracking on the bench. Evidence: standard test steps reference Kelvin resistance checks, thermal chamber or hot‑plate cycling for tracking, and power/voltage stress tests. Explanation: required equipment includes a precision LCR or 4‑wire DVM, thermal chamber or calibrated hot plate, and a stable supply; pass/fail thresholds should match datasheet tolerances plus margin (e.g., measured ratio within specified ±0.01%).
Selection checklist and procurement tips (Actionable guidance / case)
5.1 Quick datasheet checklist before buying or designing in
Point: confirm a short list of critical specs before committing. Evidence: essential datasheet entries are resistance values, absolute and ratio tolerances, TCR/tracking, power rating and derating, package/footprint, max working voltage and recommended solder profile. Explanation: document these fields on the BOM and require traceability or lot test data when design tolerance margins are tight.
- Resistance values and range
- Absolute & ratio tolerances
- TCR and tracking (ppm/°C)
- Power per element and derating curve
- Package footprint and pinout
- Max working voltage and operating temperature
5.2 Equivalent parts and common replacement pitfalls
Point: substitutions must match both electrical and thermal behavior. Evidence: differences in ratio tolerance, tracking, package thermal resistance and topology are common reasons replacements fail. Explanation: use a simple decision flow—if candidate ratio tolerance ≤ 0.02% and tracking ≤ 10 ppm/°C and footprint/pinout match, accept; otherwise reject. Watch for different bussed vs. isolated element arrangements and altered derating curves.
Conclusion
Point: the most critical datasheet fields for selecting a precision network are resistance/ratio tolerance, TCR/tracking, power and voltage limits, package footprint and reliability test results. Evidence: these fields appear in every manufacturer datasheet and control accuracy, drift and survivability in precision divider and sensor applications. Explanation: confirm numbers on the official datasheet and verify with bench tests before final design release.
For the MPMT2001AT5 specifically, confirm the resistance options and the published ratio tolerance and tracking figures in the datasheet, validate power and voltage limits relative to application stress, and run Kelvin resistance and thermal tracking tests during evaluation to ensure real‑world performance meets system accuracy goals.
Key summary
- Confirm resistance values, absolute and ratio tolerances—ratio tolerance dictates matched‑element divider accuracy and is often tighter than absolute tolerance.
- Check TCR and tracking (ppm/°C); translate to expected drift by multiplying by the expected temperature span for realistic drift estimates.
- Validate power per element, package derating and max working voltage; mechanical footprint and pinout must match to avoid layout and thermal mismatches.
FAQ
How should a designer use the MPMT2001AT5 datasheet to size a precision divider?
Use the datasheet resistance table and ratio tolerance to calculate initial divider error (ratio mismatch ≈ δ/2 for a 1:1 divider), then apply tracking/TCR to estimate temperature drift. Verify power dissipation per element and ensure max working voltage exceeds expected signals; finalize with Kelvin resistance checks.
What bench tests confirm ratio tolerance and tracking claims from the datasheet?
Perform 4‑wire (Kelvin) resistance measurements on multiple samples to confirm ratio tolerance. Use a thermal chamber or hot plate to cycle across the intended temperature span and record differential resistance to calculate tracking (ppm/°C). Compare measured values to datasheet limits with pass/fail margins.
What are the common pitfalls when replacing a resistor network from the datasheet?
Common pitfalls include mismatched topology (bussed vs. isolated), different ratio tolerance or tracking, altered package thermal resistance affecting derating, and incompatible footprint/pinout. Always compare ratio and tracking numbers, verify footprint, and run a short validation test before committing to a replacement.
Why is ratio tolerance more critical than absolute tolerance for this component?
For matched elements like dividers, the error depends on the difference between resistors. A ±0.01% ratio tolerance ensures that even if absolute values shift slightly, their relationship remains precise, which is vital for maintaining measurement accuracy in bridge sensors and ADC scaling.