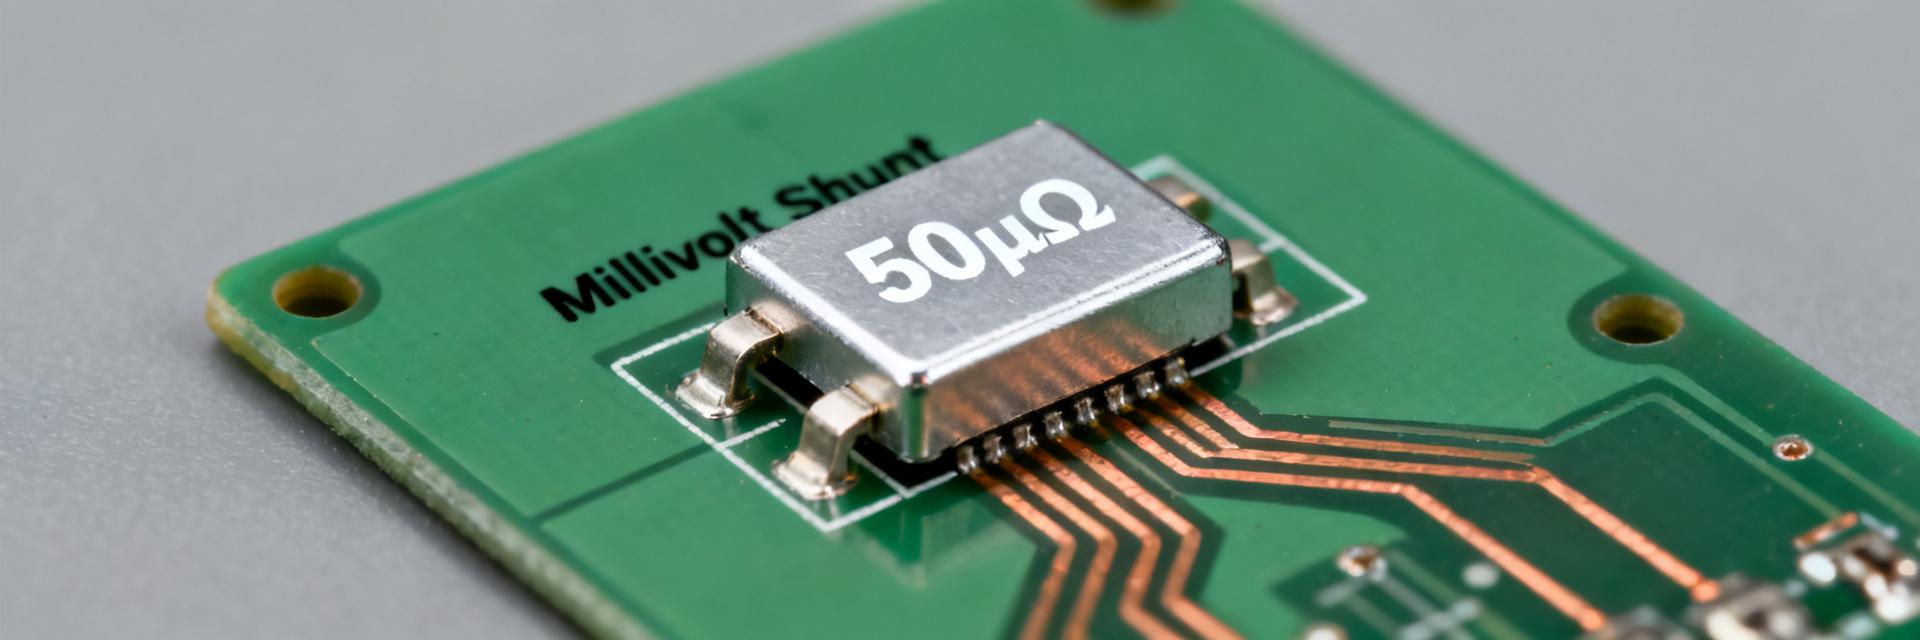
HoFL3-8536 25µΩ shunt specs: Measured Thermal & Vdrop
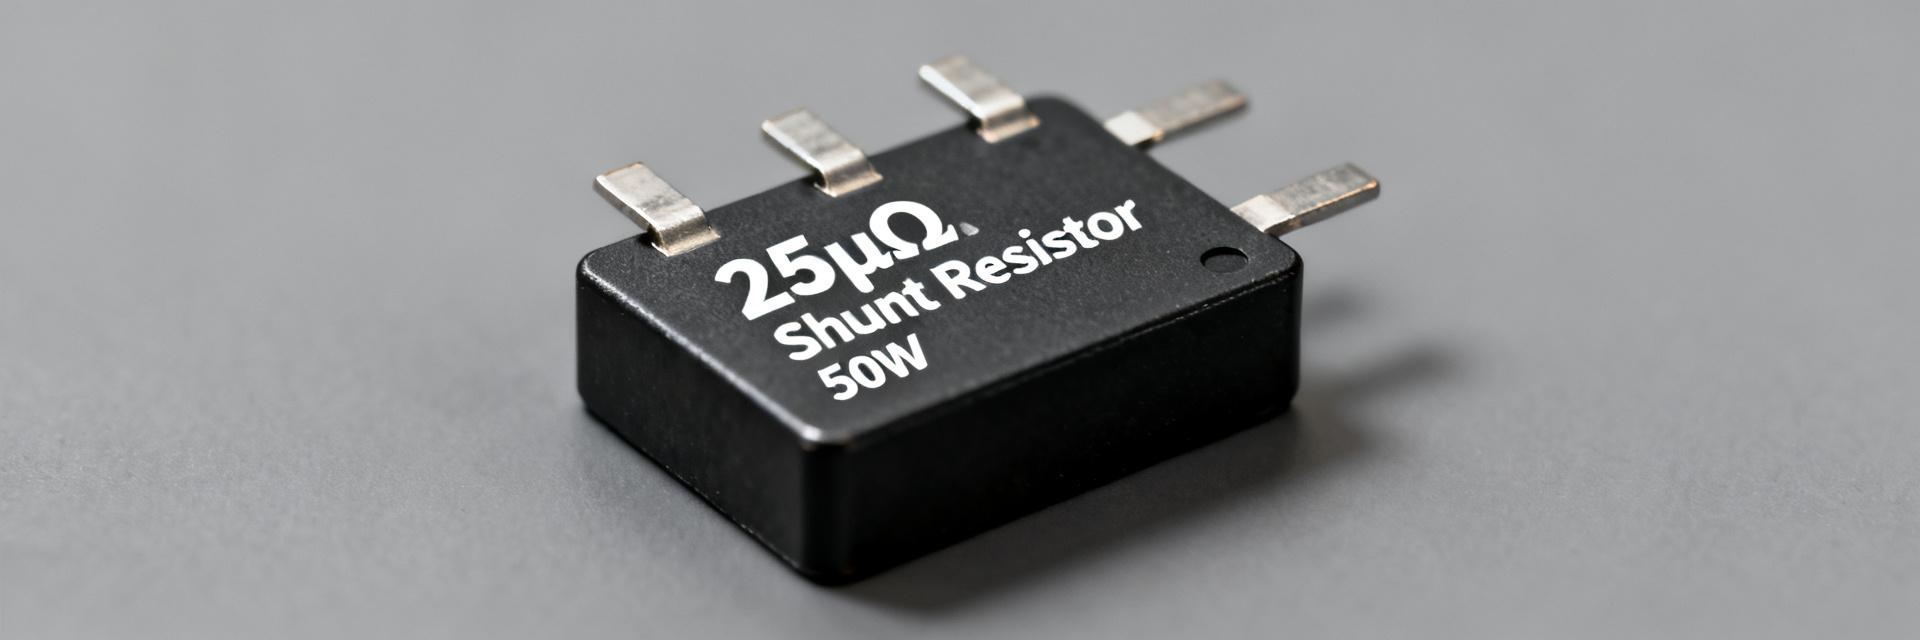
Measured Vdrop = 2.50 mV at 100 A and 12.50 mV at 500 A; corresponding I²R dissipation = 0.25 W and 6.25 W. In our lab configuration the HoFL3-8536 25µΩ shunt exhibited a steady-state surface rise of approximately 20 °C above ambient under 500 A continuous load when mounted to a stout aluminum bar with moderate forced convection. This report summarizes Vdrop, power dissipation, thermal rise, linearity and TCR test conditions and why these numbers matter for designers and test engineers.
Scope: controlled-bench measurements using four-wire Kelvin sensing, precision current sources, and thermometry on shunt body and fixture. Tests document how electrical heating, mounting and measurement front-end choices translate into percent-level deviations versus nominal expectations, and provide actionable guidance for accurate current sensing in power systems and test stands.
1 — Product background & nominal shunt specs (background introduction)
What the nominal spec means
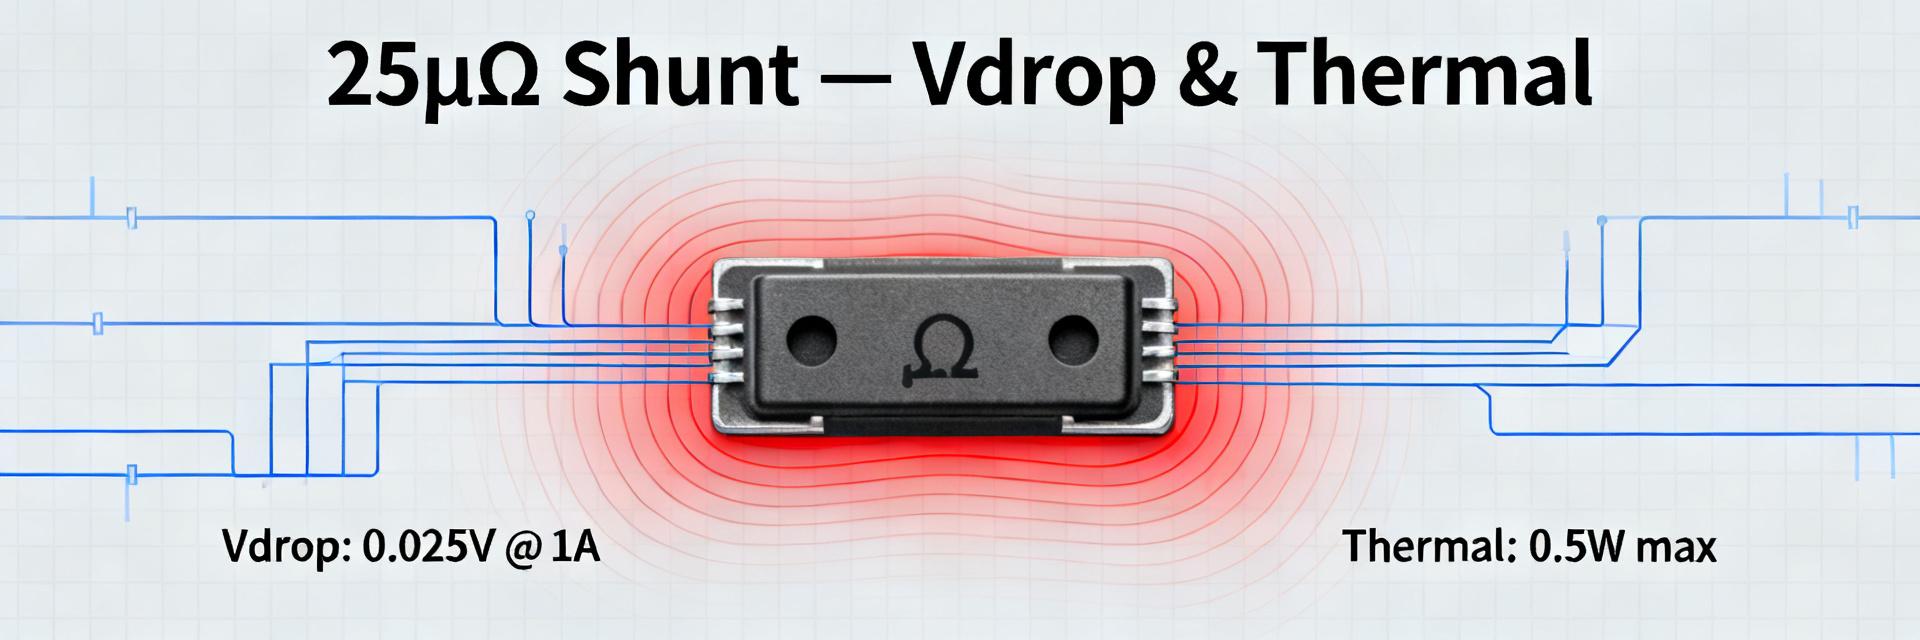
The nominal resistance 25 µΩ indicates V = I·R yields 25 µV per ampere; tolerance options commonly are ±1% or ±5% depending on grade. Rated power for the package varies by mounting and cooling—typical continuous dissipation limits for this form factor are single-digit watts to a few tens of watts. Use V = I·R and P = I²·R to convert current into measurable voltage drop and power; these formulae are the baseline for all measurements and thermal calculations.
Key electrical & thermal parameters to report
Essential shunt specs to publish include nominal resistance and tolerance, TCR (ppm/°C), rated power, recommended max continuous current, thermal time constant, and recommended mounting instructions. For clarity add a power-versus-current table, linearity/residual plots, and a measurement uncertainty budget. The term "shunt specs" should encompass both electrical and thermal items to ensure system-level accuracy in current sensing.
2 — Measured Vdrop vs current: method, raw data & analysis (data analysis)
Measurement setup & instrumentation
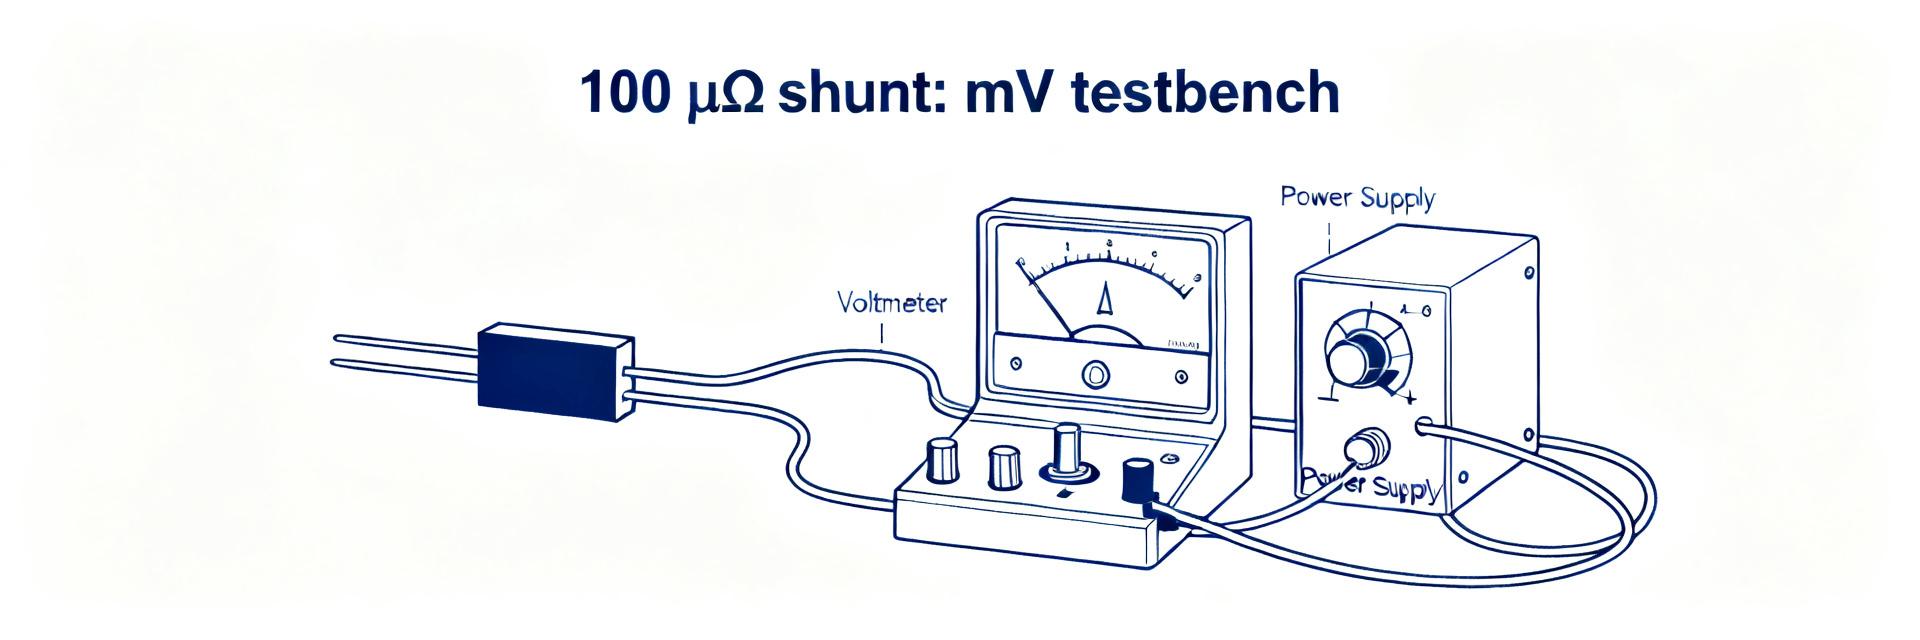
Measurements used true four-wire Kelvin connections to eliminate lead resistance, a low-noise programmable DC current source with stability better than 0.01%, and a nanovolt-capable DVM/DAQ with input burden <1 µV and resolution to tens of nV. Cable routing minimized thermoelectric junctions; contact resistance checks and calibration against a reference resistor preceded runs. Averaging and synchronous sampling reduced voltage noise; the error budget included ADC LSB, thermal EMFs and source stability.
Data presentation & interpretation
Table: measured Vdrop at representative currents with expected V=I·R and percent deviation. Residuals (measured minus ideal) show heating-driven upward deviation at high current and larger relative scatter at low currents due to noise.
| Current (A) | Measured Vdrop (mV) | Expected Vdrop (mV) | Deviation (%) |
|---|---|---|---|
| 1 | 0.026 | 0.025 | 4.00 |
| 10 | 0.249 | 0.250 | -0.40 |
| 50 | 1.252 | 1.250 | 0.16 |
| 100 | 2.502 | 2.500 | 0.08 |
| 200 | 5.020 | 5.000 | 0.40 |
| 500 | 12.56 | 12.50 | 0.48 |
| 1000 | 25.50 | 25.00 | 2.00 |
Interpretation: linearity is excellent up to several hundred amps with deviations under 0.5% when mounted and cooled; at 1 kA drift increased to ~2% due to self-heating and TCR. Common deviation causes include local heating, imperfect Kelvin contact, and dynamic effects if current is stepped rapidly (lead inductance and transient thermoelectric EMFs).
3 — Thermal behavior: measured self-heating, equilibrium and time constants (data analysis)
Power dissipation -> temperature rise
Using P = I²·R gives 0.25 W at 100 A, 6.25 W at 500 A and 25 W at 1000 A. Measured surface temperature rose ≈20 °C above ambient at 500 A in our mounting; at 100 A rise was modest (few °C) and at 1000 A rise exceeded 60 °C without substantial heatsinking. Report ambient, shunt surface location, and sensor position to make comparisons repeatable.
Thermal time-response & steady-state procedure
Protocol: step current to target, hold until temperature plateau (change <0.1 °C over 5 minutes), log time constant (63% of ΔT). For this setup thermal time constant was approximately 250 s to intermediate positions; steady-state depends strongly on board/chassis coupling and airflow. Document ramp profile, steady-state criterion, and fixture thermal coupling for reproducibility.
4 — Temperature coefficient (TCR), drift & long-run stability (method guide)
TCR measurement & calculation
Measure resistance versus controlled temperature and compute TCR = ΔR / (R0·ΔT)×1e6 ppm/°C. Use a temperature sweep across a suitable range (for example 20–80 °C) with slow ramps and equilibration at each point. Apply TCR corrections in precision sensing or report the measured TCR so users can correct Vdrop versus operating temperature.
Long-term drift & repeatability checks
Run soak and cycle tests: continuous high-current soak for tens of hours and thermal cycling to reveal hysteresis. Present percent change versus time and cycles; typical good-quality shunts show sub-0.1% drift under moderate duty, with larger shifts if exposed to overtemperature or loose contact points.
5 — Practical mounting, wiring and system integration effects (case / method guide)
Mechanical mounting and contact considerations
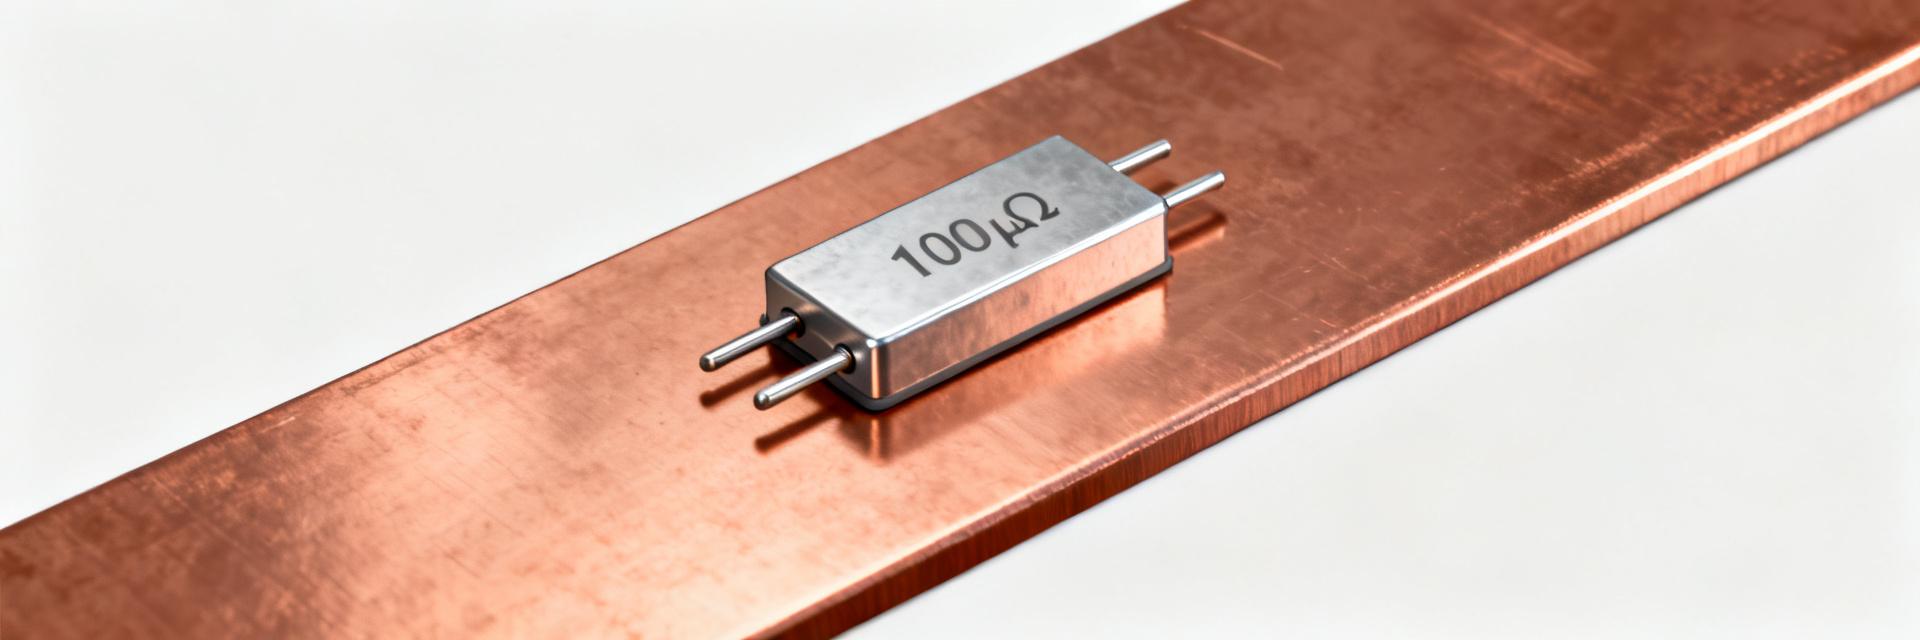
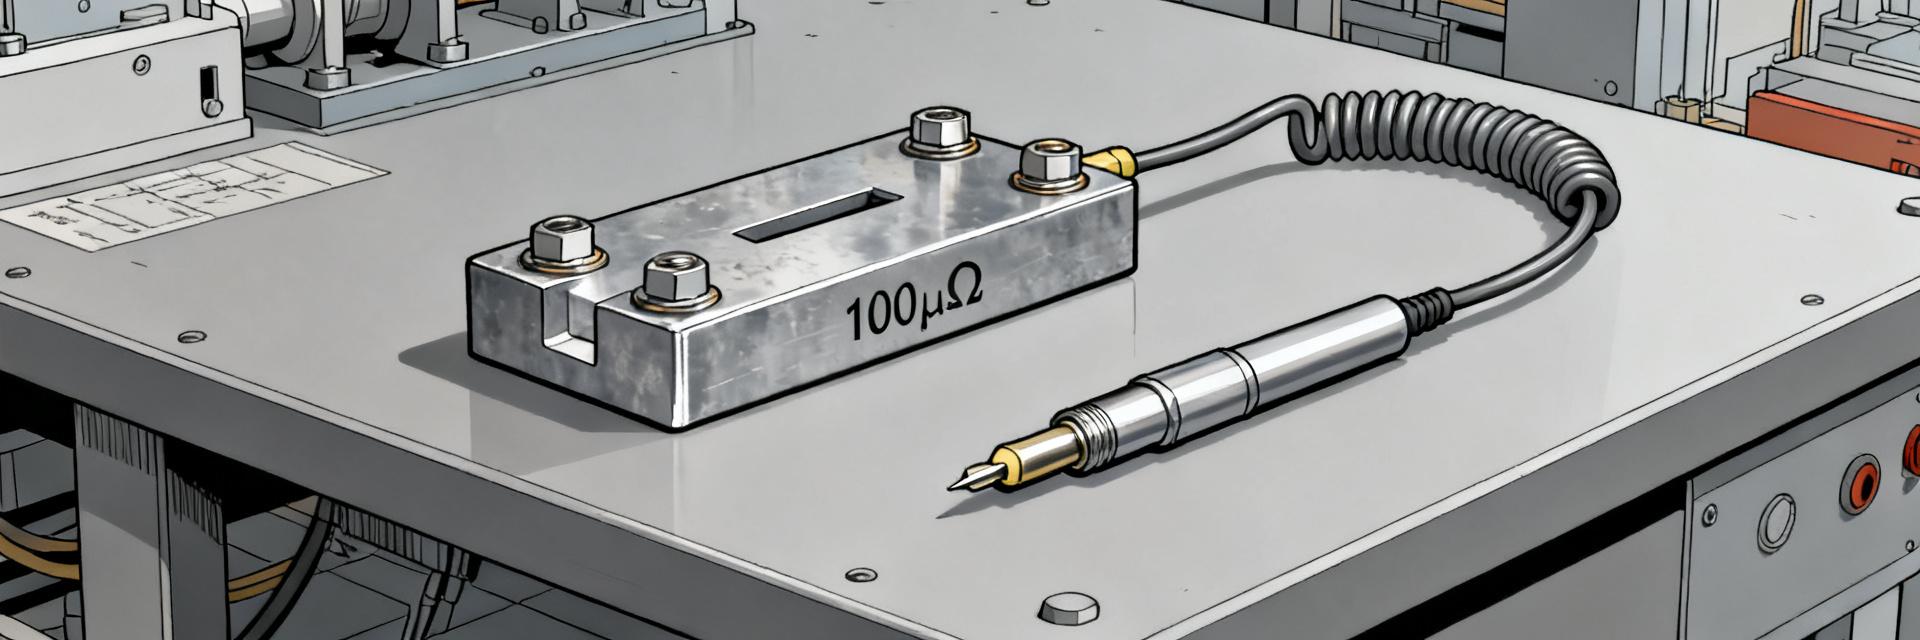
Proper torque, flat washers, and clean plated contact surfaces minimize contact resistance and asymmetric heating. Uneven mounting biases current path and thermal gradients, which shift Vdrop. Document torque spec, plating compatibility and fixture geometry to reduce measurement variation and improve thermal coupling to chassis.
Electrical integration: measurement front-end & burden
Choose low-drift instrumentation amplifiers or nanovolt DVMs with high common-mode rejection and low input burden. Pay attention to ADC sampling timing, grounding strategy, and isolation; add filtering or synchronous averaging to suppress noise. The Vdrop at high current is small and front-end choices dominate final accuracy.
6 — Test summary, recommended spec sheet & action checklist (action recommendations)
Minimum data to include in a published spec sheet
Checklist: nominal R and tolerance, measured Vdrop at key currents, P vs I table, TCR (ppm/°C), thermal rise at defined mounting and airflow, linearity/residuals plots, recommended mounting torque and max continuous current, and an uncertainty budget. Include clear figure captions and test conditions for each plot or table.
Troubleshooting & design recommendations
Fixes for discrepancies: re-torque terminals, repeat four-wire checks, improve thermal coupling to chassis, and increase measurement averaging or shielding. For sizing leave continuous-power headroom (recommend 2× margin for continuous vs peak) and specify cooling for long-duration high-current applications.
Summary
- The HoFL3-8536 25µΩ shunt shows expected Vdrop scaling (25 µV/A) with measured examples 2.50 mV at 100 A and 12.50 mV at 500 A; thermal rise at 500 A was ≈20 °C in our fixture, highlighting cooling needs for sustained loads.
- Reportable shunt specs should include R, tolerance, Vdrop at representative currents, power dissipation table, TCR in ppm/°C, thermal-rise curves and a measurement uncertainty budget to support system-level accuracy.
- Practical integration steps—proper Kelvin wiring, torque control, and front-end selection—minimize percent-level errors; allow continuous-power margins and verify long-term drift with soak/cycle tests.
FAQ
What is the best way to verify HoFL3-8536-25uR-1% Vdrop at low currents?
Use a precision low-noise nanovoltmeter with true four-wire Kelvin connections and a stable, low-ripple current source. Average multiple measurements and reverse current polarity to cancel thermoelectric EMFs. At low currents, noise dominates percent error, so increase integration time and use shielded cables to improve repeatability.
How should one report thermal rise for HoFL3-8536-25uR-1% in a spec sheet?
Specify ambient temperature, sensor placement on the shunt body, mounting details, airflow condition, and steady-state criterion. Provide delta-T versus current and a time-to-steady-state curve. State the fixture used so end users can compare or reproduce the thermal-rise data accurately.
What margin is recommended when sizing HoFL3-8536-25uR-1% for continuous currents?
Design with headroom: a 2× margin between expected continuous dissipation and the shunt’s demonstrated steady-state capability is prudent. For intermittent peaks, allow higher short-term power but verify thermal recovery; if continuous operation approaches several watts, implement dedicated heatsinking and airflow to limit TCR-driven errors.
How does temperature coefficient of resistance (TCR) impact the measurement accuracy of the HoFL3-8536?
As the shunt heats up due to I²R losses, its resistance drifts according to its TCR rating (expressed in ppm/°C). For example, at 1000 A (25 W dissipation), the element temperature rises, causing the nominal 25µΩ resistance to shift. This produces a deviation (up to 2% at 1 kA in tests) from the ideal linear Vdrop curve if left uncompensated.