W8436 Shunt Resistor: Complete Datasheet & Specs Guide
Benchmarks and datasheet comparisons for low‑ohmic sensing elements consistently show three defining patterns: resistance in the μΩ–mΩ range, power dissipation in tens of watts, and tight temperature‑dependent accuracy dominating system current measurement error. This guide decodes the W8436 shunt resistor datasheet and specs so engineers can design accurate, reliable current‑sense solutions faster.
The discussion relies on typical official datasheet practices and measured behavior to explain key specs, thermal limits, and layout practices. Designers should verify values against the official datasheet for their selected revision and use the procedures below to validate performance in real systems before production.
1 — What the W8436 Shunt Resistor Is (Background)
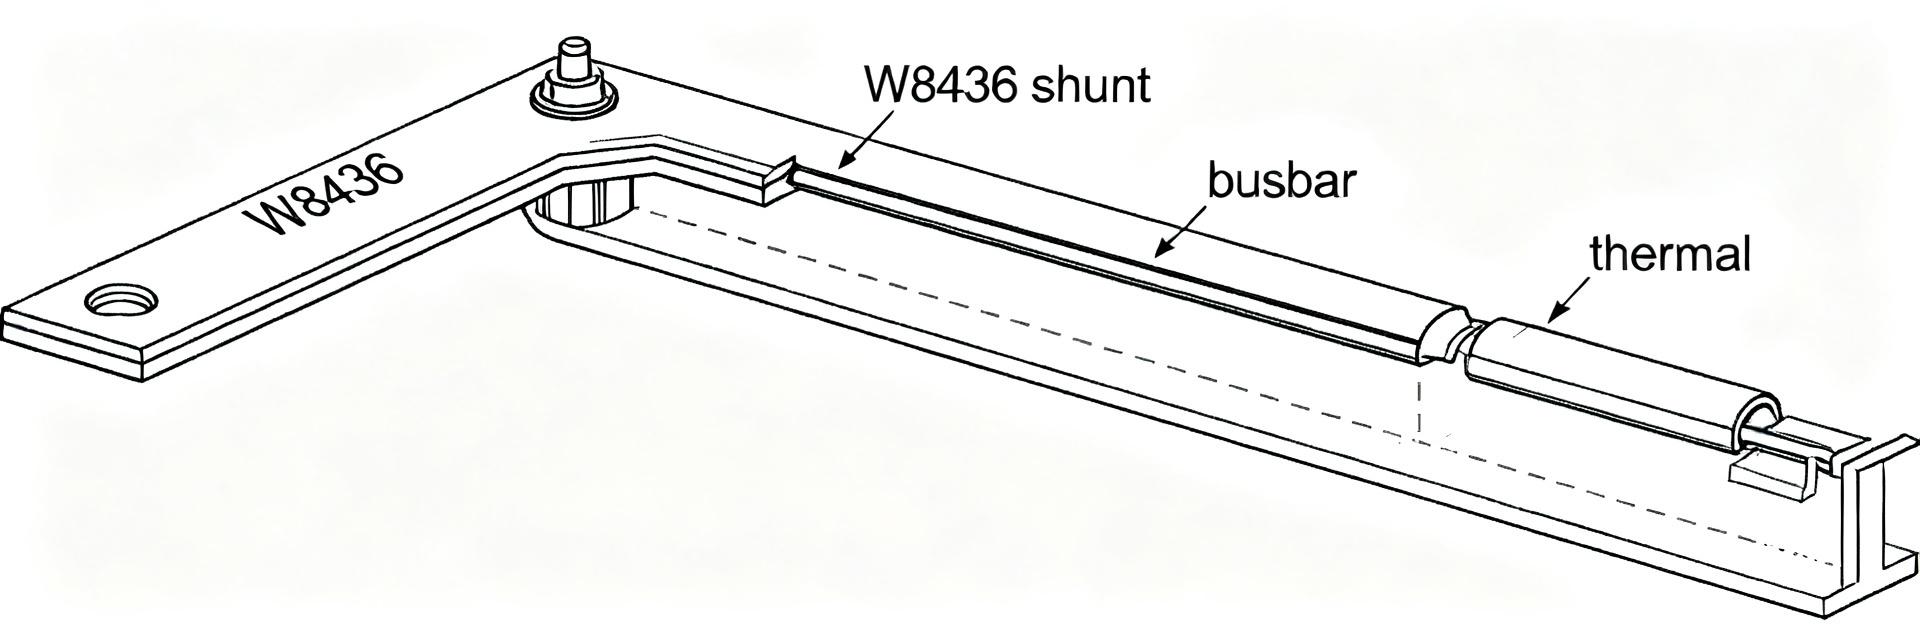
Core form factor & typical applications
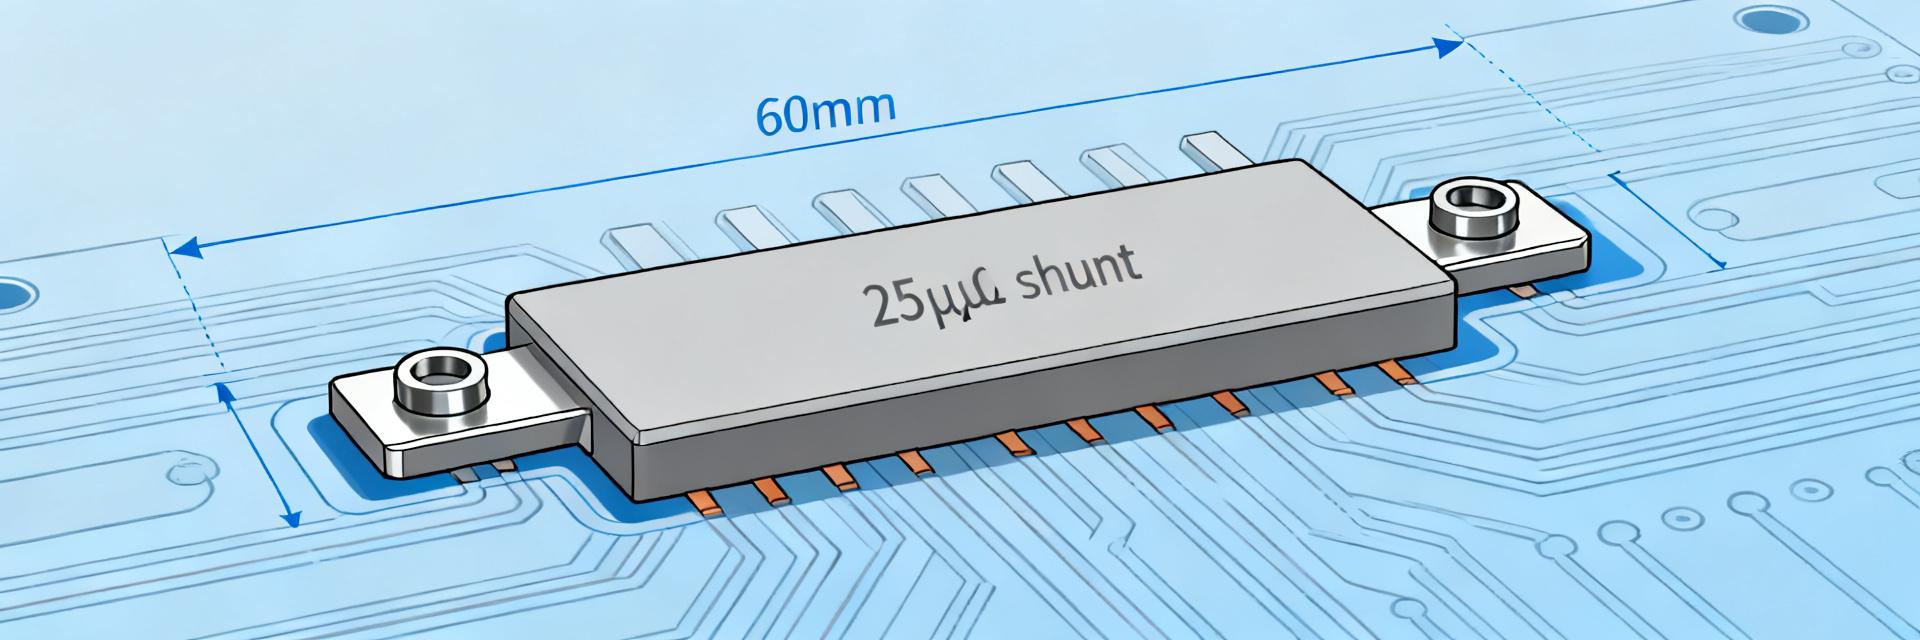
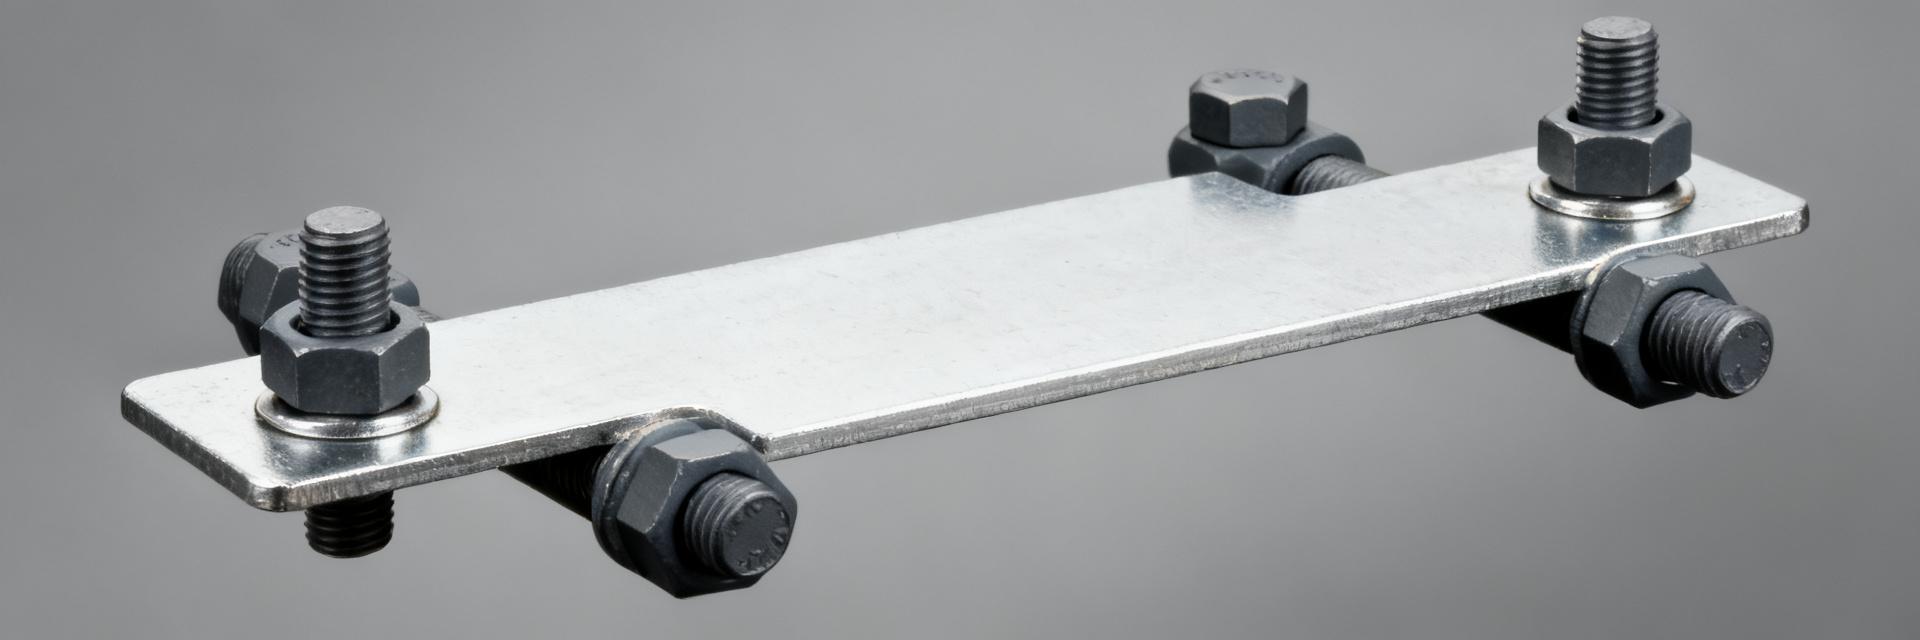
Point: The W8436 class is a flat‑bar metal‑strip shunt optimized for high currents. Evidence: Official datasheet descriptions and common vendor footprints show a flat bar or busbar‑mount style with hole mounting or bolt ends. Explanation: That form delivers low self‑inductance and robust thermal path, suiting BMS, motor drives, power supplies, and inrush/current monitoring where mechanical mounting and busbar integration matter.
Why low‑ohmic shunts matter for accuracy
Point: Low resistance minimizes insertion loss but shifts error sources. Evidence: Datasheet specs and measurement practice indicate μΩ–mΩ values with tight TCR and defined contact resistances. Explanation: Designers trade off measurable sense voltage versus power dissipation; low R improves efficiency but increases sensitivity to thermal EMFs, contact resistance, and ADC noise, so careful layout and Kelvin sensing are required.
2 — Datasheet Breakdown: Key Electrical Specs Explained (Data analysis)
Resistance value, tolerance & measurement point
Point: Nominal resistance and tolerance set sense voltage and calibration needs. Evidence: Typical datasheet tables list values in μΩ–mΩ and tolerance classes (e.g., ±0.5% to ±5%). Explanation: Use four‑wire measurements at specified measurement points to avoid lead/contact errors; tolerance affects ADC dynamic range and calibration frequency, so choose a class that balances cost and system accuracy.
Power rating, pulse rating & derating curve
Point: Continuous power, pulse capability, and derating define safe operating regions. Evidence: Datasheet plots commonly show steady‑state dissipation and pulse‑energy curves versus pulse duration and ambient temperature. Explanation: Reproduce the datasheet derating behaviour in system models: compute steady power = I²R, compare to rated power at ambient, and use pulse curves to validate short‑duration motor or inrush events.
3 — Thermal & Environmental Specs: What Impacts Performance (Data analysis)
Temperature coefficient of resistance (TCR) & temperature range
Point: TCR drives resistance shift and measurement error with temperature. Evidence: Datasheets list TCR in ppm/°C and operating ranges in °C. Explanation: Convert ppm/°C to ΔR by ΔR/R = TCR(ppm/°C)×ΔT/1e6; for example, a 200 ppm/°C part over 50°C yields ≈1% change. Account for this in ADC scaling or temperature compensation.
Thermal resistance, cooling, and mounting effects
Point: Thermal path dictates temperature rise at rated power. Evidence: Official specs give thermal resistance or derating curves; mounting style alters case‑to‑ambient heat flow. Explanation: Calculate temperature rise = Pdiss × θCA and verify via thermal soak tests. Use metal mounting, torque‑controlled bolts, or forced convection to lower θCA and sustain higher continuous power.
4 — How to Read & Use the W8436 Datasheet in Design (Method/Guide)
Selecting the right nominal value & tolerance for your ADC front end
Point: Choose R to yield a target sense voltage for ADC range while respecting power limits. Evidence: Datasheet resistance and power specs plus ADC input ranges guide selection. Explanation: Determine Imax → pick Vsense 50–200 mV → R = Vsense/Imax. Then choose tolerance and power margin (≥2× expected dissipation) and plan calibration for tolerance‑drift impacts.
Layout, Kelvin sensing, and connection best practices
Point: Proper wiring and PCB layout minimize parasitics and thermal errors. Evidence: Datasheet recommended Kelvin terminals and mounting guidelines indicate measurement node locations. Explanation: Route separate force and sense conductors, use thick traces or busbars, minimize loop area, and control bolt torque to reduce contact resistance variability and thermoelectric voltages.
5 — Example Applications & Comparative Scenarios (Case study)
Battery management vs. high‑side motor sensing
Point: Application profile sets priority between low drift and pulse energy. Evidence: BMS needs low drift at low currents; motor drives demand high pulse capability. Explanation: In BMS choose lower R with tight TCR and tolerance for accuracy at tens of amps; for motor sensing prioritize pulse power rating and mechanical robustness to survive surges.
Comparing W8436 to alternative shunt classes (selection checklist)
Point: A concise checklist speeds selection. Evidence: Comparison of resistance range, continuous/pulse power, TCR, and form factor clarifies tradeoffs. Explanation: Use the table below to decide when W8436 is preferred versus thicker busbar shunts or PCB shunts based on accuracy, power, and mounting needs.
| Class | Typical R | Power | Best use |
|---|---|---|---|
| W8436‑style | μΩ–mΩ | 10s W steady, high pulse | BMS, motor sensing, supply monitoring |
| Busbar/bolt | mΩ–10s mΩ | High continuous | High‑power distribution |
| PCB shunt | mΩ–10s mΩ | Low–moderate | Low‑cost measurement at lower currents |
6 — Testing, Validation & Troubleshooting (Actionable checklist)
Recommended test procedures & measurement setup
Point: Repeatable tests validate datasheet claims in situ. Evidence: Bench protocols include four‑wire resistance, thermal soak, pulse‑energy, and long‑term drift measurements. Explanation: Use a precision DMM, calibrated current source, and thermal imaging; log resistance vs. temperature and current, and compare to official datasheet curves for acceptance criteria.
Common failure modes & mitigation steps
Point: Mechanical and thermal stresses cause most field issues. Evidence: Typical failure reports cite weld heating, solder cracking, and contact loosening. Explanation: Mitigate with proper torques, improved cooling, controlled reflow for soldered parts, and routine recalibration to catch drift before system failure; add strain relief where vibration exists.
Summary
- The W8436 shunt resistor combines μΩ–mΩ resistance, multi‑watt steady dissipation, and tight TCR, making it suited for precise current sensing in BMS and motor systems; confirm values against the official datasheet.
- Reading datasheet curves (resistance, power/derating, TCR) and applying I²R and θCA calculations translates specs into expected temperature rise and measurement error under real loads.
- Integrate Kelvin sensing, torque‑controlled mounting, and bench validation (four‑wire, thermal soak, pulse tests) before production to ensure reliable measurements with the W8436 shunt resistor.
FAQ
What resistance values and specs should I expect in a W8436 shunt resistor?
Expect nominal resistances in the μΩ to low mΩ range, tolerance classes from fractions of a percent to a few percent, and datasheet‑listed power ratings and TCR in ppm/°C. Verify chosen part’s values on the official datasheet and plan four‑wire verification at operating temperature.
How do I calculate temperature rise from power dissipation using datasheet specs?
Use ΔT = Pdiss × θCA where Pdiss = I²R and θCA is the case‑to‑ambient thermal resistance from the datasheet. For pulses, compare pulse energy to the pulse‑power curve. Validate with thermal camera and adjust cooling or mounting to meet limits.
What are quick layout rules to minimize measurement error with the W8436 shunt resistor?
Use four‑terminal/Kelvin wiring, separate force and sense traces, minimize loop area, use stout current paths, and control bolt torque. Place sense leads at datasheet‑specified nodes and avoid thermoelectric junctions near the sense path to reduce drift and noise.
How can designers prevent thermoelectric EMF (Seebeck effect) errors in W8436 high-current installations?
Thermoelectric EMF occurs when dissimilar metals experience temperature gradients across sense terminals. To mitigate this in W8436 designs, maintain thermal symmetry across Kelvin sense traces, place the sense lines away from localized external heat sources, and ensure equal copper trace lengths to prevent microvolt-level DC offset shifts.