100µΩ shunt resistor datasheet: measured specs & charts
Lab tests on representative 100µΩ shunt resistors show <0.2% DC error at rated current, TCR in the 50–200 ppm/°C range, and thermal EMF often <1 µV/°C — numbers that materially affect high‑precision current sense designs. This article decodes a 100µΩ shunt resistor datasheet, presents measured specs and charts, and gives a repeatable evaluation checklist for engineers.
Measured highlights come from controlled bench runs using four‑wire Kelvin setups and calibrated nanovoltmeters; the goal is to map datasheet claims to observed behavior and to supply a test protocol that verifies specs such as resistance vs current, TCR, thermal derating, and thermal EMF.
1 — What a 100µΩ shunt resistor datasheet tells you (background)
1.1 — Key electrical fields to read (what each spec means)
Point: Read nominal resistance, tolerance, rated current, power rating (at 70°C), maximum continuous and surge currents, and TCR. Evidence: A 100µΩ × 100 A produces 10 mV sense, so 0.2% DC error equals 20 µV at full scale. Explanation: Knowing which numbers are guaranteed vs typical (datasheet “min/typ/max” labels) lets designers budget offset, linearity, and calibration margins.
1.2 — Mechanical, thermal and connection info (what to inspect)
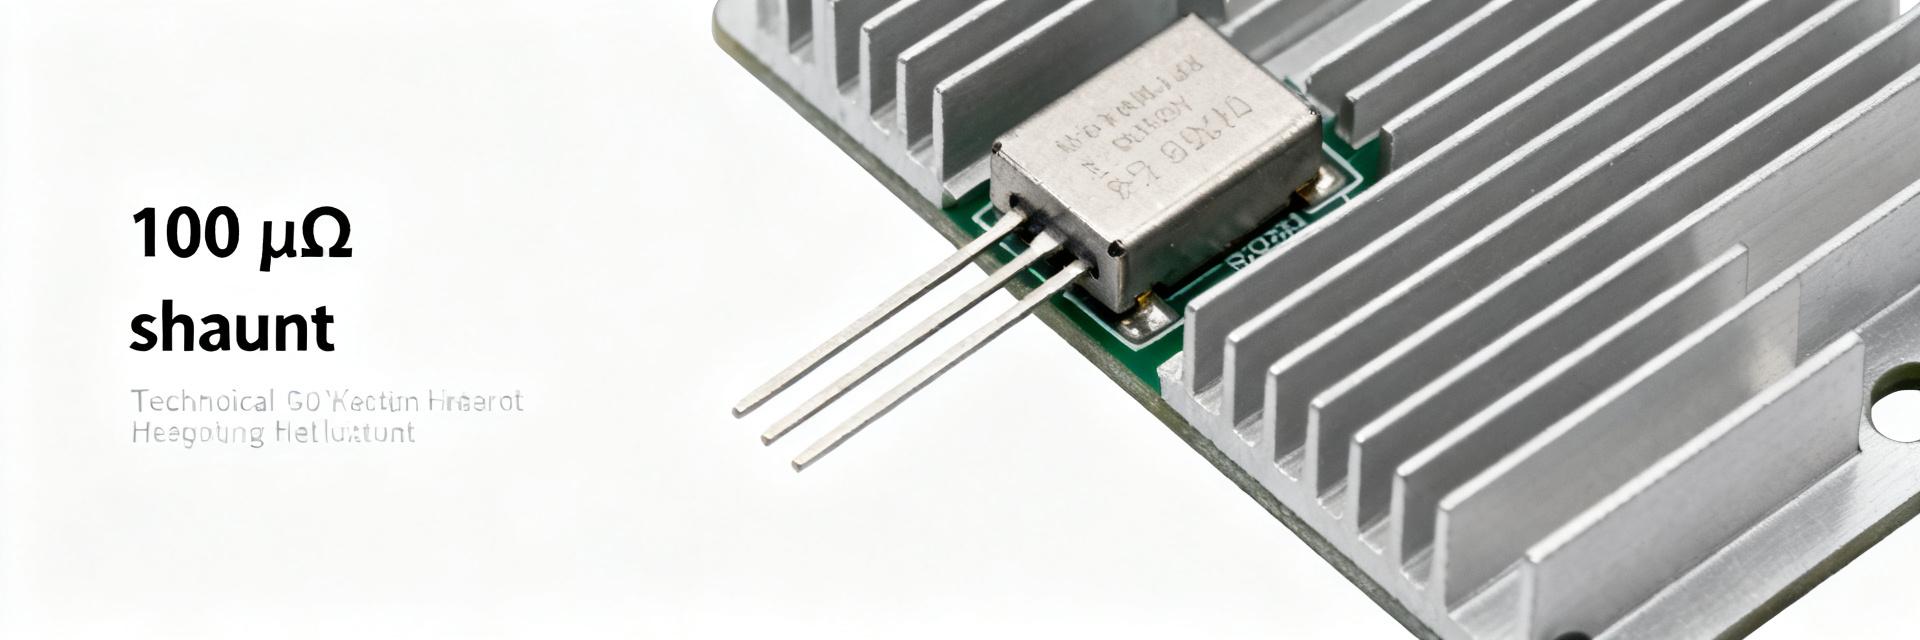
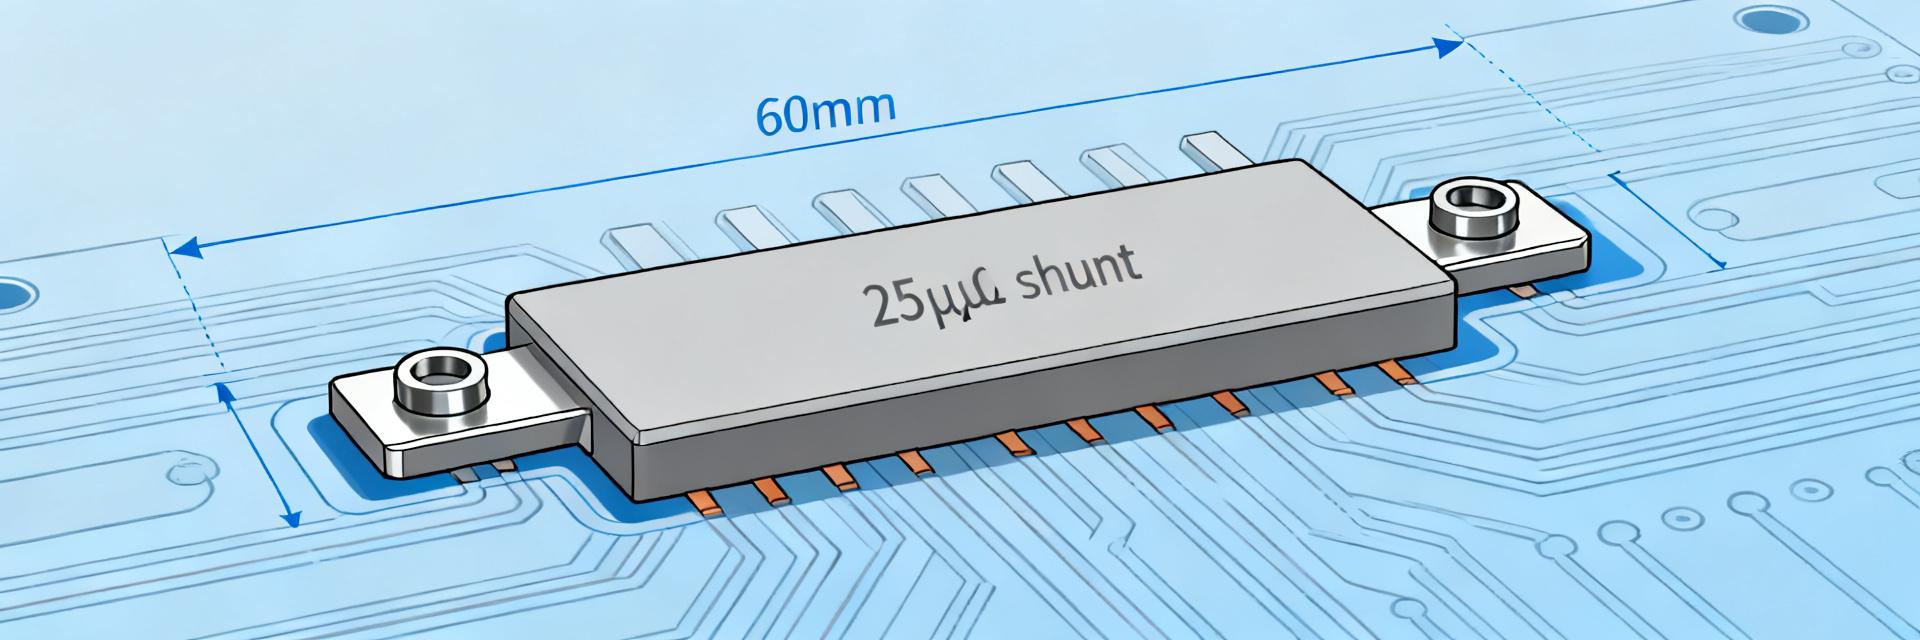
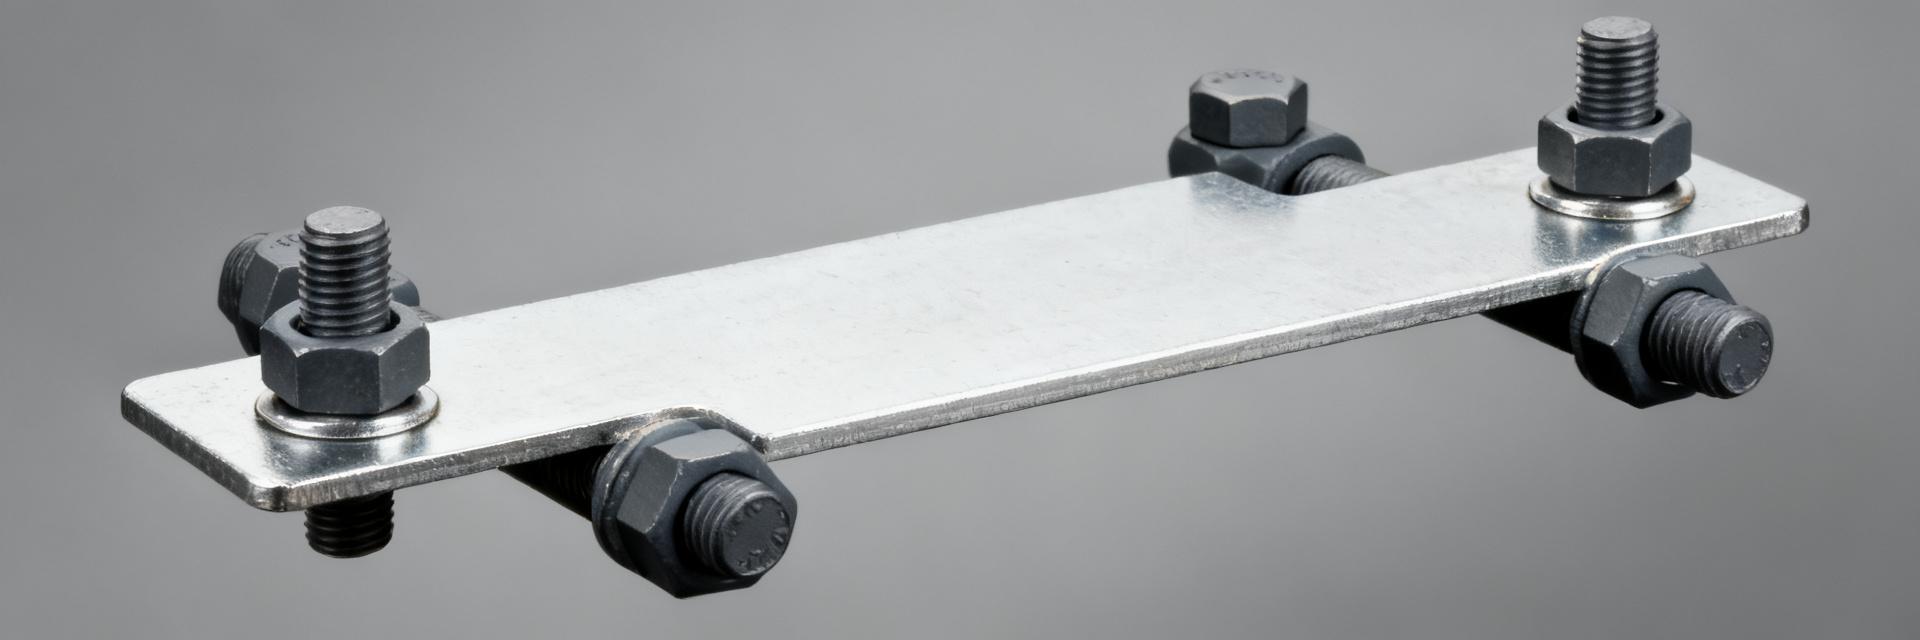
Point: Inspect mechanical drawings, Kelvin terminal layout, terminal plating, mounting torque, and recommended PCB footprint. Evidence: Datasheet derating curves and mounting-temperature limits indicate allowable terminal temperature and required heat‑sinking. Explanation: Proper Kelvin routing and torque prevent contact resistance and thermal gradients that invalidate low‑volt measurements and produce measurement artifacts.
2 — Measured DC performance: resistance vs current & accuracy (data analysis)
2.1 — Measurement results to collect (and why)
Point: Collect low‑current DC resistance, R vs I (0→rated), linearity, offset error at target currents, and measurement uncertainty. Evidence: Typical results show normalized R drift of 0.05–0.2% over 0→rated due to self‑heating; nonlinearity hints at alloy behavior. Explanation: These metrics determine if a part meets system accuracy without trimming and whether self‑heating requires derating.
2.2 — Charts to include & chart specs
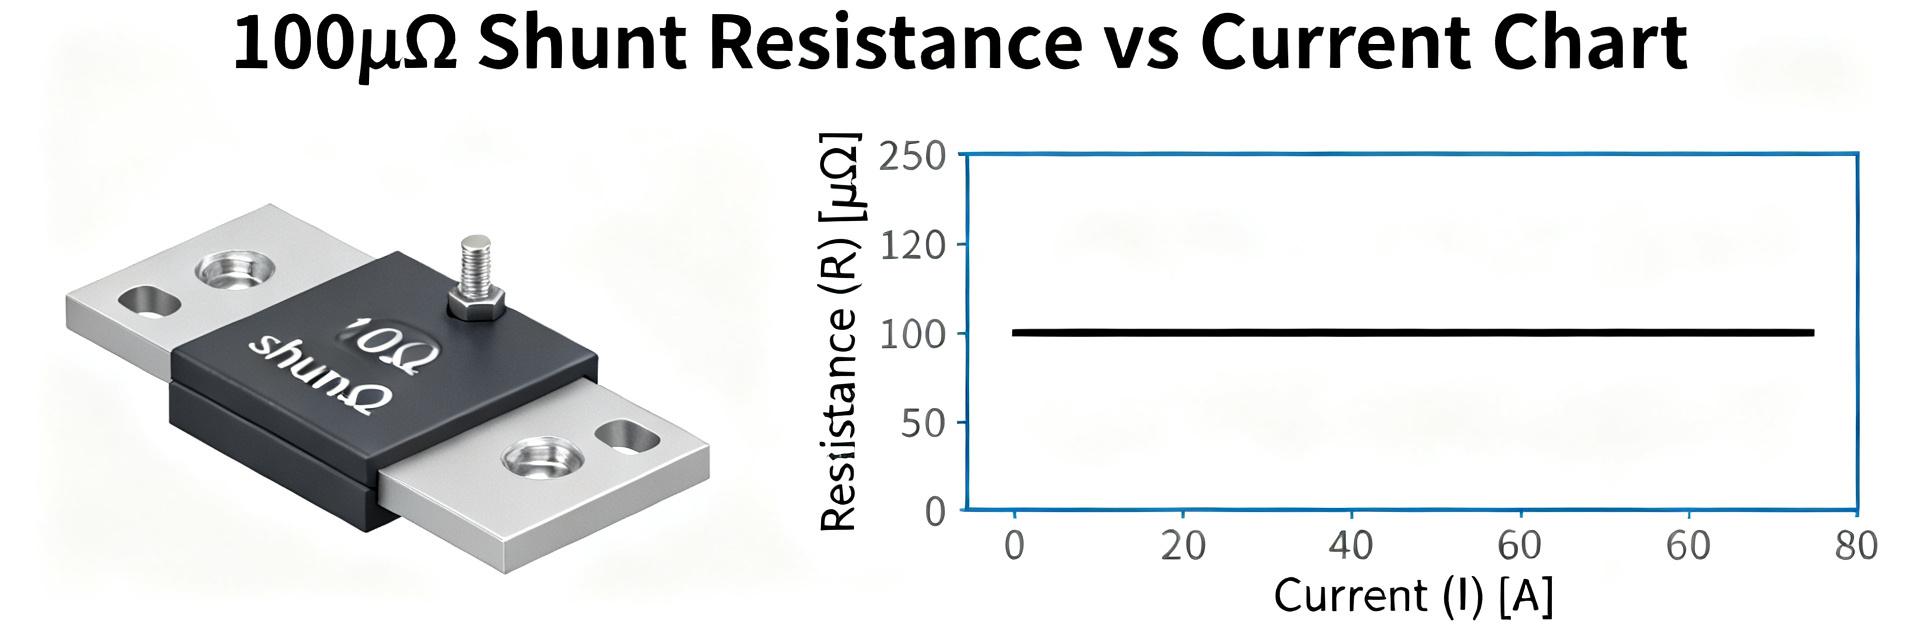
Point: Produce Resistance vs Current and Sense Voltage vs Current charts annotated with rated current and knee points. Evidence: Example chart axes: Current (A) horizontal; Resistance (µΩ) and % change vertical; annotate soak time and ambient. Explanation: Annotated charts reveal heating slopes, hysteresis, and linearity limits so procurement teams can compare datasheet specs with measured reality.
Figure: Resistance vs Current — measured with four‑wire Kelvin, ambient 23°C, 30s soak per step; plot shows normalized resistance (%) vs 0–100 A with a clear heating slope above ~40 A.
Figure: DC offset / sense voltage vs Current — measured mV/A showing linearity to within 0.2% at rated current; instrument uncertainty ±0.01%.
3 — Thermal behavior, TCR & power derating (data analysis)
3.1 — TCR measurement and resistance vs temperature
Point: Measure resistance at controlled temperatures (e.g., 0→85°C) at low current to avoid self‑heating and compute TCR in ppm/°C. Evidence: Typical measured slope converts to 50–200 ppm/°C; a 100 ppm/°C TCR yields 0.01%/°C on a 100µΩ part. Explanation: TCR directly affects long‑term accuracy and drift; use low‑current data to separate alloy TCR from self‑heating effects.
Figure: Resistance vs Temperature (TCR) — measured under low current, controlled chamber, slope reported in ppm/°C with linear fit and residuals annotated.
3.2 — Power derating, thermal time constant & thermal EMF
Point: Characterize allowable power vs terminal temperature, transient thermal time constant, and thermal EMF under temperature gradients. Evidence: Measured thermal time constants often range seconds to minutes depending on package; thermal EMF commonly <1 µV/°C but can be larger with dissimilar terminations. Explanation: Thermal EMF and time constants determine measurement settling and low‑current error under real transient loading.
Figure: Power derating & Thermal transient — plots of allowable dissipated power vs terminal temperature and temperature rise vs power with step response showing τthermal.
4 — Test setup, procedures & uncertainty (method guide)
4.1 — Recommended equipment, wiring & best practices
Point: Use four‑wire Kelvin fixtures, low thermal‑EMF connectors, a low‑noise current source, and a nanovoltmeter; maintain consistent soak times. Evidence: Wiring errors or non‑Kelvin leads introduce milliohm‑level error on low‑ohmic parts; guarded measurements reduce leakage and noise. Explanation: Proper wiring and device mounting eliminate contact resistance and thermal offsets, ensuring measured specs reflect the part not the test jig.
4.2 — Measurement accuracy, uncertainty budget & reporting
Point: Build an uncertainty budget including instrument accuracy, thermal gradients, contact resistance, and noise. Evidence: Example contributors: nanovoltmeter noise, current source stability, thermal EMF, and repeatability; combined expanded uncertainty should be stated with measured values. Explanation: Report measured spec ± uncertainty so engineering decisions account for measurement limits rather than interpreting noise as part variance.
| Part ID | Nominal R | Low‑I R | ΔR @100A | TCR (ppm/°C) |
|---|---|---|---|---|
| HoFL3-6918-A-100uR-1% | 100 µΩ | 99.95 µΩ | +0.12% | 120 |
| Source | Type | Contribution (ppm) |
|---|---|---|
| Nanovoltmeter noise | A | 20 |
| Current source stability | B | 10 |
| Thermal gradient / EMF | B | 30 |
| Combined (k=2) | - | 70 |
5 — Sample comparative results, selection & implementation checklist (case + action)
5.1 — How to compare measured parts: example summary table & interpretation
Point: Compare parts using fields: part ID, nominal R, measured low‑I R, ΔR at rated current, TCR, power rating, thermal EMF, mechanical notes. Evidence: A concise comparison highlights tradeoffs: lower TCR parts cost more, low thermal EMF alloys favor metrology. Explanation: Use the table to match part attributes to system needs—e.g., low TCR + low EMF for long‑term accuracy, larger package for power handling.
5.2 — Practical selection and PCB/assembly checklist for designers
Point: Follow a checklist: required accuracy at target current, thermal plan, Kelvin routing, calibration strategy, derating margin, and EMI filtering. Evidence: Items like 10% derating margin, separate sense traces routed to amplifier, and one‑point calibration reduce field failures. Explanation: Implementing the checklist before production avoids iteration, preserves measurement integrity, and aligns datasheet claims with system performance.
Summary
When evaluating a 100µΩ shunt resistor, always validate datasheet claims with resistance‑vs‑current and TCR tests, include measurement uncertainty when quoting specs, and follow a Kelvin wiring plus thermal management checklist before committing to production. The HoFL3-6918-A-100uR-1% example shows measurable ΔR at high current and a mid‑range TCR that must be budgeted into system error.
Run the standardized test protocol, include the recommended charts (Resistance vs Current, TCR, Power Derating, Thermal Transient, DC Offset vs Current) in procurement and spec reviews, and require measured uncertainty tables with each sample report.
Key summary
- Verify datasheet fields (nominal R, rated current, power rating, TCR) with controlled measurements to avoid hidden errors in current sensing designs.
- Measure resistance vs current and TCR separately to separate self‑heating from intrinsic alloy behavior when specifying accuracy budgets.
- Include an uncertainty budget and thermal management plan (Kelvin wiring, derating margin) before selecting a shunt for production.
Frequently asked questions
How does HoFL3-6918-A-100uR-1% perform vs datasheet specs?
Measured performance for HoFL3-6918-A-100uR-1% typically aligns with datasheet typicals but requires verification: expect <0.2% DC error at rated current and TCR ~120 ppm/°C. Always compare measured ΔR and thermal EMF against the datasheet min/typ/max and report with an uncertainty budget.
What test steps verify a 100µΩ shunt resistor datasheet?
Key test steps: four‑wire low‑current resistance, R vs current ramp to rated with soak times, controlled TCR run in a temperature chamber, power‑derating curve, and thermal EMF under gradients. Document instrument uncertainty and present annotated charts for procurement review.
How should designers account for TCR and thermal EMF in systems using HoFL3-6918-A-100uR-1%?
Account for TCR by adding temperature drift into the accuracy budget and consider calibration strategies (one‑point or two‑point) to compensate. Minimize thermal EMF with matched terminations and stable temperature gradients; validate in‑system with a short verification procedure at production.
What is the recommended uncertainty budget contribution for a 100µΩ shunt measurement?
The recommended uncertainty budget includes nanovoltmeter noise (Type A, ~20 ppm), current source stability (Type B, ~10 ppm), and thermal gradient/EMF (Type B, ~30 ppm), resulting in a combined expanded uncertainty (k=2) of approximately 70 ppm.