MPM2002AT0 דפי נתונים - ניתוח מעמיק: דיוק ויציבות
Core Insight: The datasheet lists tight ratio tolerance (single-digit ppm matching), tracking figures near 1–5 ppm/°C, and long-term drift under tens of ppm over 1,000 hours; these values set the baseline for sub-ppm system stability. These metrics drive divider-based references and matched resistor networks, allowing design engineers to budget error terms accurately for high-resolution ADCs and instrumentation.
Early overview matters because small ppm numbers translate directly to measurement accuracy. Ratio matching and low TCR reduce gain and offset shifts across temperature, aiding engineers in deciding when a single-chip matched network replaces discrete trimming or calibration in precision paths.
Background: Why MPM2002AT0 Matters in Precision Designs
What the Datasheet Asserts
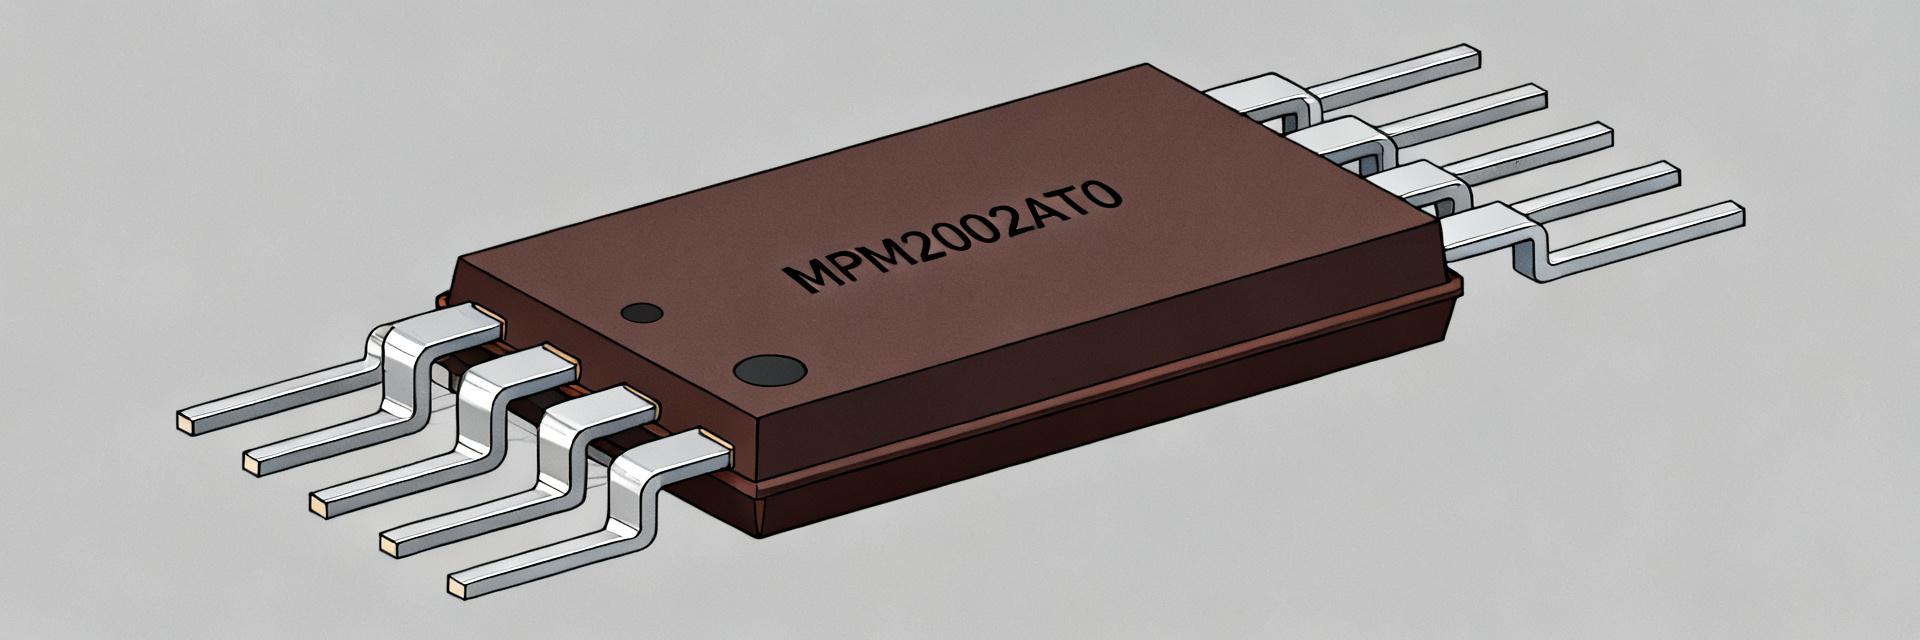
The datasheet states core claims: ratio tolerance, absolute resistor values, temperature coefficients, SOT-23 package parameters, and recommended operating windows. Stated ratio matching and TCR figures are presented alongside recommended voltages and power ratings. For precision applications, these entries define whether the device can replace multi-resistor matched networks without added calibration.
Quick Spec Snapshot for Engineers
| Metric Parameter | Technical Significance | Engineering Action Item |
|---|---|---|
| Ratio Tolerance | Controls divider linearity and initial gain error. | Check ppm-level matching first. |
| Absolute Tolerance | Affects total divider error when one side is referenced to ground. | Assess system input impedance matching. |
| TCR Tracking | Evaluates tracking drift (ppm/°C) over operating temperature range. | Calculate worst-case temperature delta. |
| Power & Voltage Rating | Ensures no self-heating or electrical overload. | Keep operating power well below maximum limits. |
| Stability/Drift | Long-term ppm drift over 1k+ hours under load. | Budget for end-of-life calibration intervals. |
Verify in-lab values vs. datasheet. Bench checks for TCR and drift expose assembly or thermal issues. Trust the datasheet for baseline selection, but validate under system thermal and mechanical conditions before production.
MPM2002AT0 Key Datasheet Metrics — What to Trust and What to Verify
Ratio Accuracy, Absolute Tolerance, and Matching
Ratio tolerance differs fundamentally from absolute resistor tolerance; matching is the parameter that matters most for voltage dividers. A 5 ppm ratio error at 5 V yields about 25 nV-equivalent at comparator inputs per volt scaled. Designers should convert ppm specs into LSB error for their target ADCs to judge acceptability across temperature and supply variations.
Thermal Behavior: TCR, Tracking, and Package Thermal Paths
Tracking TCR defines how well resistor pairs move together with temperature versus individual TCR. A 1 ppm/°C tracking yields much lower relative error across a 50°C swing than a 50 ppm/°C individual TCR. Package thermal gradients and board mounting can break tracking, so layout and thermal isolation are crucial for preserving long-term stability.
MPM2002AT0 Performance Analysis & Test Methods
Measurement Setup to Verify Precision
Measurement topology must minimize source and meter noise to reveal true device error. Use low-noise voltage sources, high-resolution DMMs or delta-sigma ADCs, and four-wire/Kelvin connections. Include warm-up, averaging, and differential measurement techniques; guard traces and shielding reduce leakage and bias currents that otherwise mask ppm-level behavior.
Stress and Stability Tests to Reproduce Datasheet Claims
Reproducing datasheet life and drift requires controlled thermal and humidity regimes. Thermal cycling (e.g., −40°C to 85°C) and soak tests with monitored bias recreate common failure signatures. Track resistance change, hysteresis, and drift over staged intervals, log results, and compare them to stated long-term ppm drift acceptance criteria.
Design Use-Cases & Examples
High-Resolution ADC Reference Divider: Schematic & Layout Notes
A matched resistor network in the reference path reduces calibration burden. Placing the divider close to the ADC reference pin and using short, symmetric traces minimizes thermal EMFs and parasitic resistance. Add local low-ESR decoupling, avoid routing near heat sources, and use Kelvin pads for critical measurement nodes to preserve the network's published matching.
Low-Noise Amplifier and Sensor Front-End Examples
Ratio stability directly affects closed-loop gain and bridge conditioning accuracy. Using the device in feedback or bridge networks keeps gain drift low if matching and TCR tracking hold. Pair with low-noise op amps, filter upstream noise, and include input guarding and RC filtering to prevent dynamic mismatch from degrading precision.
Practical Implementation Checklist & Troubleshooting
PCB, Grounding, and Thermal-Management Checklist
- Place the device away from power dissipating parts to reduce gradients.
- Use dedicated copper pours and thermal vias to control heat flow.
- Provide Kelvin pads and short symmetric traces for matched legs.
- Follow recommended soldering profiles and avoid excessive dwell on hot plates.
- Consider isolation or guard rings for high-impedance nodes.
Common Issues, Diagnostics, and Fixes
Typical failure modes include mechanical stress, thermal drift, and contamination. Observed shifts often correlate with assembly stress or flux residue. Apply strain relief, controlled reflow profiles, clean assemblies, and plan recalibration intervals; use conformal coating only where it won’t induce stress on thin-film elements.
Summary
The most system-impacting datasheet metrics are ratio tolerance, tracking TCR, and long-term drift; they translate directly into gain and offset budgets. Translating ppm specs into LSBs for the target ADC clarifies acceptability. Validate key numbers on the bench with a proper low-noise setup, manage PCB thermal paths, and adopt layout and assembly practices that preserve the device’s published precision.
Key Summary
- MPM2002AT0 ratio tolerance and matching dominate divider accuracy; convert ppm specs into ADC LSB error to set acceptance criteria and calibration needs.
- Tracking TCR (ppm/°C) is more important than individual TCR for system precision; control thermal gradients through placement and copper management.
- Bench verification—low-noise source, Kelvin wiring, warm-up and repeated averaging—confirms the datasheet claims before committing to production.
Common Questions and Answers
How should I verify MPM2002AT0 ratio tolerance on the bench?
Use a low-noise voltage reference and a high-resolution meter with four-wire connections. Warm the assembly to operating temperature, perform differential measurements between resistor legs, average repeated reads, and compare converted ppm results against the datasheet’s ratio tolerance. Proper guarding and shielding reduce measurement artifacts.
What thermal tests validate MPM2002AT0 tracking and TCR?
Run controlled temperature ramps and soak points while monitoring differential resistance. Perform a bi-directional temperature cycle to reveal hysteresis and use small step ramps (e.g., 10°C steps) to compute ppm/°C tracking. Look for divergence between legs as an indicator of thermal gradient or mounting issues.
How do I mitigate assembly-induced drift for MPM2002AT0?
Minimize mechanical strain by avoiding tight traces that bend components, follow conservative reflow profiles, clean flux residues, and use strain relief for connectors. If drift persists, introduce a short qualification burn-in and schedule periodic recalibration in the system to account for any residual long-term drift.
Why does ratio tolerance matter more than absolute tolerance in divider networks?
Ratio tolerance controls divider linearity and limits gain/offset errors in high-resolution ADC references, whereas absolute tolerance only shifts the total resistance, which has minimal effect on ratiometric accuracy.