דף נתונים NGW75T65H3DFP: VCE(sat) וניתוח תרמי
Introduction: The NGW75T65H3DFP is a 650 V-class, 75 A trench field-stop IGBT rated for junction temperatures up to 175 °C. Accurate VCE(sat) characterization and thermal modeling determine conduction loss, junction rise, and long-term reliability; misestimating either leads to excessive heating, derating, or field failures. This article gives a testable walkthrough for VCE(sat) measurement, Rth/Zth interpretation, and a practical 3-phase inverter example.
Introduction: Goal and approach — present a concise specification snapshot, data-driven VCE(sat) trends, steady-state and transient thermal calculations, lab measurement best practices, and a worked thermal budget that engineers can reproduce in the lab and apply in system design.
1 — Quick specification snapshot (background)
Key electrical ratings and operating envelope
Point: Know the ratings that constrain conduction and switching. Evidence: the device is listed as a 650 V class, 75 A continuous device with a high TJ limit. Explanation: designers must check VCES/BV, IC (continuous and pulsed), VGE(max), gate-threshold ranges, and the SOA notes before using datasheet VCE(sat) plots to predict losses.
| Parameter | Value / Note |
|---|---|
| Device | NGW75T65H3DFP |
| Collector-emitter voltage (BV) | 650 V class |
| Continuous collector current (IC) | 75 A (package-limited) |
| Max junction temperature (TJ max) | 175 °C |
Thermal ratings & package overview
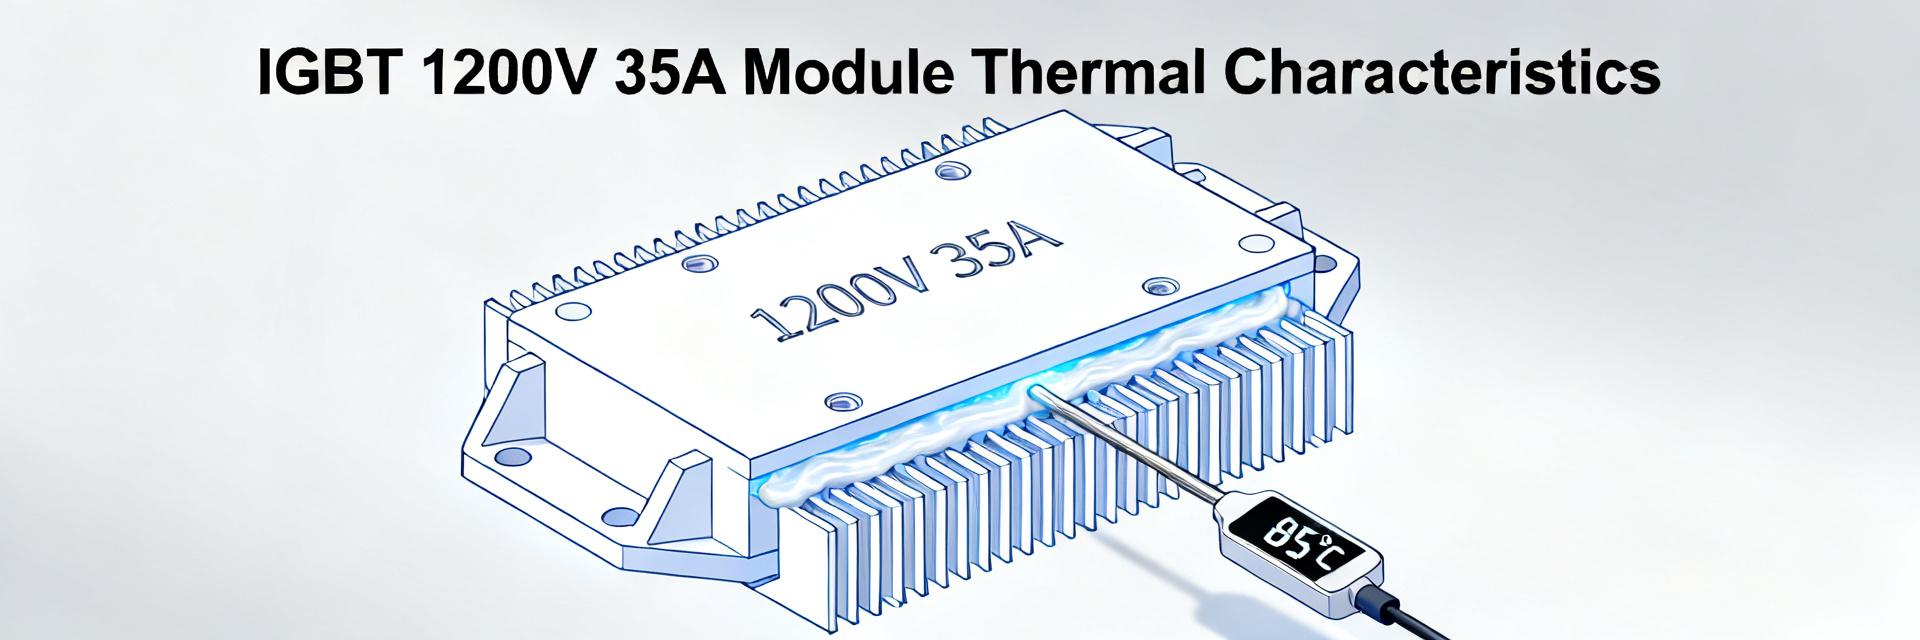
Point: Thermal interfaces determine effective cooling. Evidence: datasheet lists TJ max, recommended Tc/A limits and typically provides Rth(j‑c) and transient Zth curves. Explanation: Rth(j‑c) defines heat path to baseplate; Rth(j‑a) or case-to-ambient depends on mounting and heat-sink; both govern steady-state deltaT = P × Rth and set cooling requirements.
2 — VCE(sat) characterization and trends (data analysis)
VCE(sat) vs Ic and junction temperature
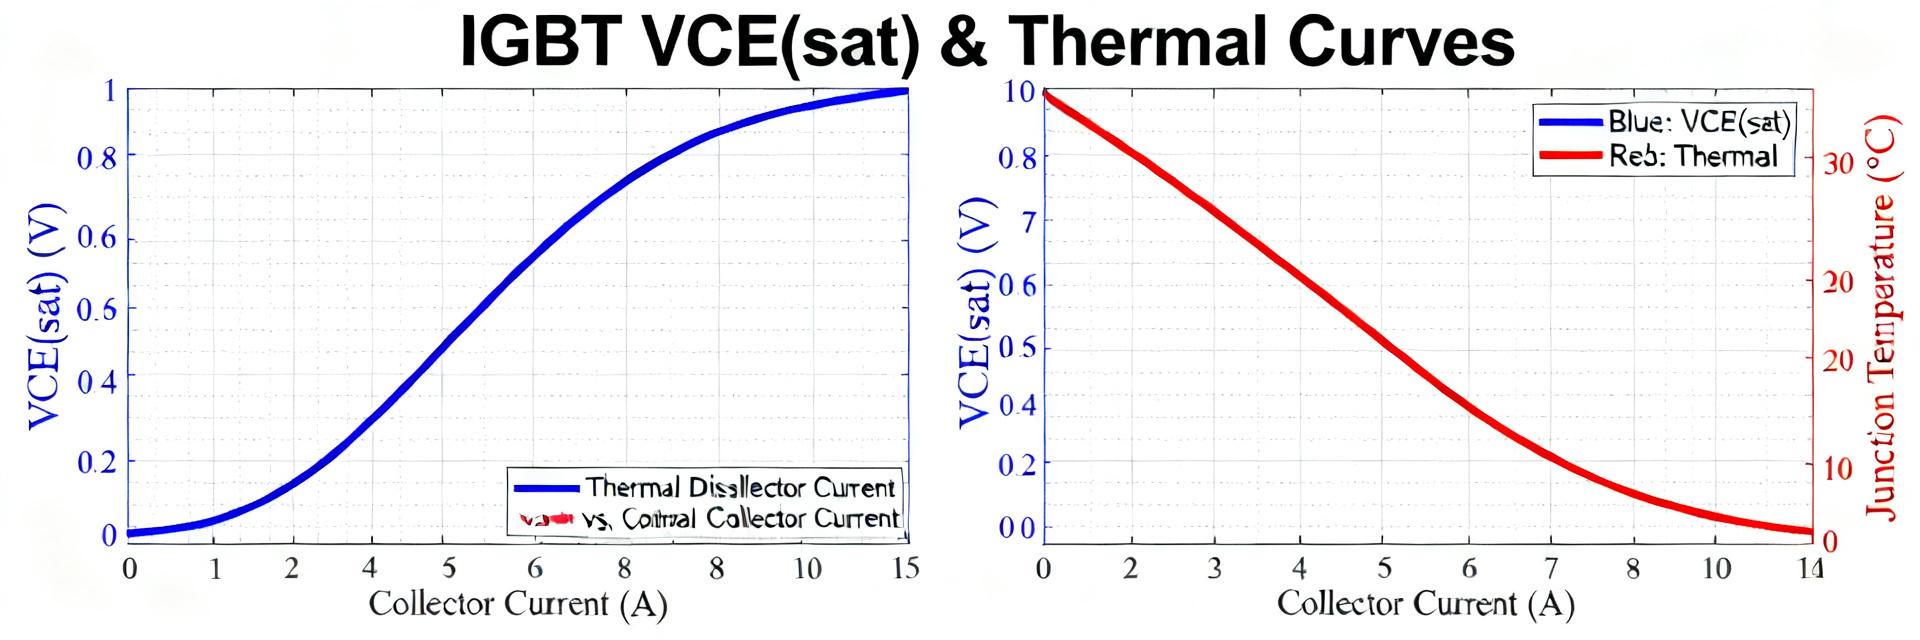
Point: VCE(sat) rises with IC and with higher Tj. Evidence: datasheet VCE(sat) plots show a positive temperature coefficient for conduction voltage at elevated junctions. Explanation: higher VCE(sat) at operating Tj directly increases conduction loss Pcon = IC × VCE(sat), so thermal feedback can accelerate heating under steady or cyclical load.
Interpreting test conditions and extrapolating realistic values
Point: Datasheet “typical” and “max” curves use specified VGE and pulse conditions. Evidence: VCE(sat) is often measured at VGE = 15 V with short pulses to avoid self‑heating. Explanation: convert those numbers to steady-state by accounting for pulse vs. DC heating, manufacturing spread, and using a margin (e.g., use datasheet max + tolerance) when budgeting conduction loss.
3 — Thermal performance: steady-state and transient (data analysis)
Junction-to-case and junction-to-ambient metrics
Point: Use Rth metrics to translate electrical loss into temperature rise. Evidence: datasheet provides Rth(j‑c) and sometimes Rth(j‑a) under defined mounting. Explanation: compute Pconduction = IC × VCE(sat); then deltaTj‑c = P × Rth(j‑c). Add case or sink temperature to get TJ. This yields steady‑state limits for specified cooling.
Transient thermal impedance and power cycling
Point: Short pulses need Zth(t) not steady Rth. Evidence: Zth(j‑c)(t) curves map energy to transient deltaT. Explanation: for pulses, compute deltaT(t) = Ppulse × Zth(t). Use single-pulse Zth for isolated events and cumulative/multi-pulse models for periodic duty cycles; thermal time constants inform heat-sink mass and airflow choices.
4 — Measurement methods: lab setup to capture VCE(sat) and thermal data (methods/guide)
Test circuit and instrumentation best practices
Point: Proper hardware prevents measurement error. Evidence: recommended setup includes a controlled current source, gate driver, Kelvin sensing, and low‑inductance layout. Explanation: mount the device on a calibrated cold plate or heat-sink, place a Tc sensor at the recommended reference point, use short current pulses to capture pulse VCE(sat) without self‑heating, and measure ambient and case temps for traceability.
Data logging, repeatability, and deriving useful curves
Point: Repeatable procedures produce reliable curves. Evidence: follow a step procedure: stabilize device, apply VGE (e.g., 15 V), sweep IC in steps, record VCE and Tc, repeat at different baseplate temperatures. Explanation: compile VCE(sat) vs IC at multiple Tj points, fit linear temperature coefficients, and document measurement uncertainty for design margins.
5 — Design case study: 3-phase inverter conduction & thermal budget (case study)
Thermal calculation worked example
Point: Apply measured VCE(sat) to compute junction rise. Evidence: choose representative per-phase RMS current and use measured or datasheet VCE(sat) at operating Tj. Explanation: compute per-device Pcon = IC_avg × VCE(sat); then TJ = Tc + P × Rth(j‑c). Add margin for worst-case VCE(sat) and high ambient when selecting heat-sink or forced-air parameters.
VCE(sat) impact on system efficiency and cooling choices
Point: Small VCE(sat) shifts materially affect system loss. Evidence: a 0.1 V increase at 75 A adds 7.5 W per device; multiplied across inverter legs that is significant. Explanation: mitigate by parallel devices, improve thermal path (lower Rth mounting), optimize gate drive to minimize on-state, or select parts with lower VCE(sat) preferrably measured under expected TJ.
6 — Practical checklist: spec reading, testing, and thermal design actions (action recommendations)
Pre-selection checklist for engineers
Point: A concise pre-check avoids surprises. Evidence: confirm VCE(sat) test conditions, verify TJ max and Rth values, and check SOA and pulsed ratings. Explanation: document expected operating IC, worst-case ambient, required derating, and search for long-tail queries like “NGW75T65H3DFP VCE(sat) measurement” to capture nuance in team notes.
PCB, mounting and cooling best practices
Point: Mechanical and PCB decisions determine Rth(j‑a). Evidence: recommended practices include large copper area, multiple thermal vias, correct baseplate torque, and quality TIM. Explanation: place Tc measurement point per datasheet, perform thermal profiling in operation, and plan for periodic checks; request additional transient Zth data from vendor if cycling is severe.
Key summary
- Accurate VCE(sat) measurement at controlled VGE and Tj is essential to estimate conduction loss and avoid thermal runaway for NGW75T65H3DFP in high‑power converters.
- Use Rth(j‑c) and Zth(t) from the datasheet together with measured P to compute steady and transient TJ; include manufacturing and measurement margins.
- Small increases in VCE(sat) magnify cooling requirements—plan heat‑sink, airflow, and layout early and validate with lab power cycling and thermal profiling.
Common questions and answers
How should NGW75T65H3DFP VCE(sat) be measured for reliable data?
Measure VCE(sat) with short, controlled current pulses at the datasheet gate voltage (commonly 15 V) using Kelvin sensing and a calibrated Tc reference. Record ambient and case temperatures, sweep IC in steps, and repeat at several baseplate temperatures to derive temperature coefficients and assess repeatability.
How do I translate datasheet VCE(sat) to steady‑state conduction loss?
Use a conservative VCE(sat) value (datasheet max plus tolerance) at expected TJ, multiply by operating IC to get Pcon. Then compute deltaT = P × Rth(j‑c) (or P × total Rth to ambient) to estimate TJ. Add margin for measurement uncertainty and possible duty‑cycle heating.
When is transient Zth essential for thermal analysis?
Use Zth when pulses or varying duty cycles dominate heating (short bursts, regenerative events, or power cycling). Compute transient deltaT = Ppulse × Zth(t) for single events and use convolution or cumulative methods for periodic pulses; rely on steady Rth only for true DC conditions.
What design steps minimize the impact of elevated VCE(sat) on overall system efficiency?
Mitigate by paralleling devices, improving thermal paths (low Rth mounting), optimizing gate drive parameters to minimize on-state voltage, and validating with precise thermal profiling under real load conditions.
Summary
Accurate interpretation of NGW75T65H3DFP VCE(sat) data plus correct use of Rth and Zth figures is critical to predict junction temperature and ensure reliable operation at full load and elevated ambient. Combine datasheet curves with careful lab measurement, apply conservative margins, and use the worked calculations and checklist when designing the cooling solution.