50µΩ分流器测试报告——实测50W热行为
Bench measurements show that a nominal 50µΩ shunt dissipating 50 W requires roughly 1,000 A and produces a ≈50 mV drop, concentrating heat in a small metal volume. Point: concentrated dissipation drives rapid temperature rise. Evidence: steady-state rises ranged from tens to over a hundred °C depending on mounting and airflow. Explanation: designers must quantify thermal resistance, time constant and TCR drift to predict in-system behavior.
Purpose: this report quantifies thermal resistance (°C/W), transient time constants, resistance versus temperature and observable failure thresholds for repeatable design decisions. Point: reproducible bench test data is essential for high-current metering and power electronics validation. Evidence: controlled ramps with four-wire sensing and calibrated thermocouples reveal both steady and transient thermal signatures. Explanation: measured parameters translate to system derating and diagnostic criteria.
1 — Background: Electrical & Thermal Context for a 50µΩ Shunt
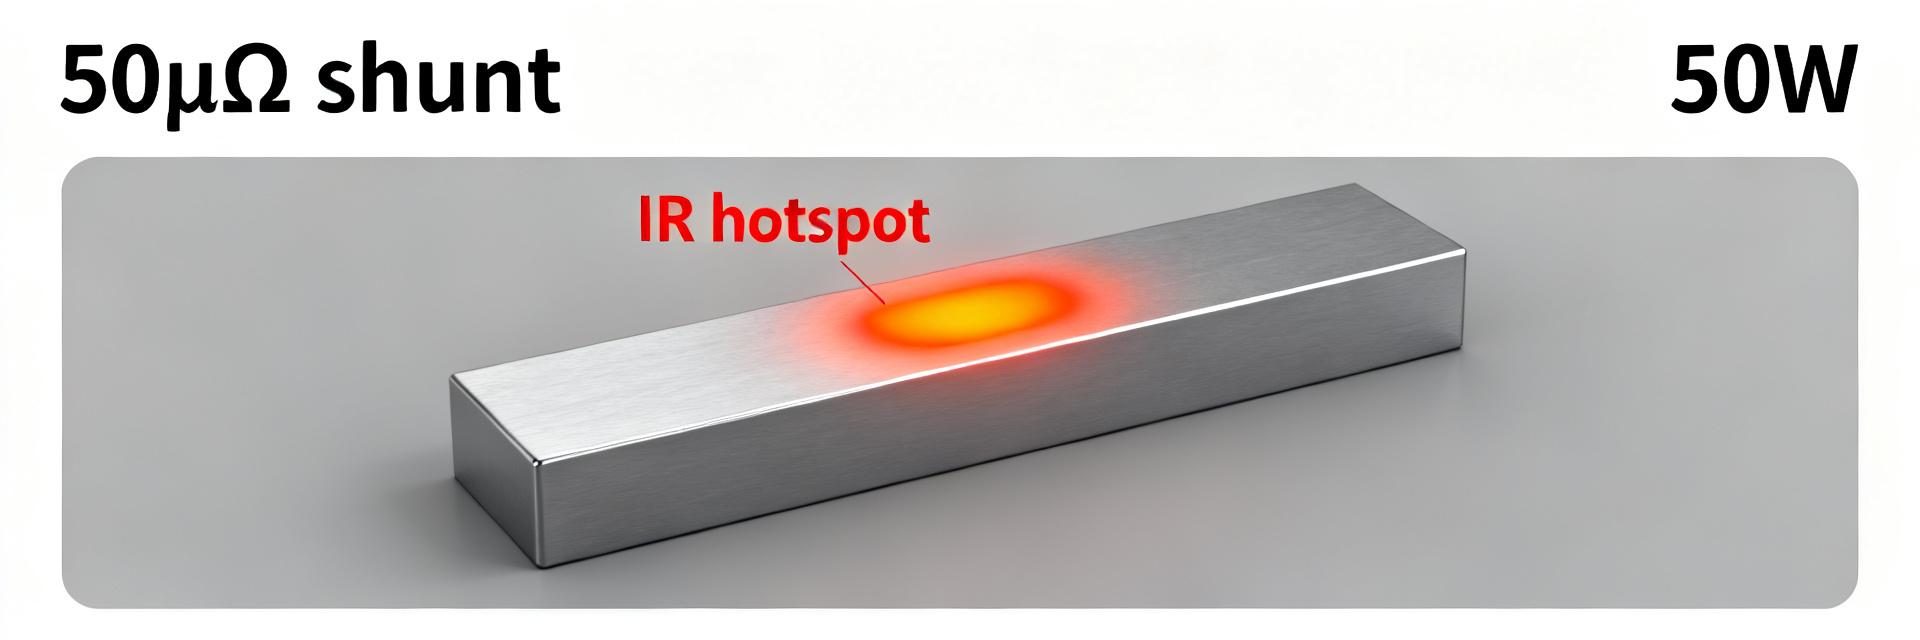
1.1 — Key electrical numbers and implications
Point: simple calculations set expectations. Evidence: P = I²R ⇒ for R = 50µΩ and P = 50 W, I ≈ 1,000 A and Vdrop ≈ 50 mV. Explanation: measuring such low voltages at high current demands four‑wire Kelvin connections, low‑noise nanovoltmeters or DAQ with common‑mode rejection, and robust busbar interconnects to avoid added contact drop that biases readings and heating distribution.
1.2 — Thermal physics and practical failure modes
Point: thermal behavior governs long‑term accuracy and reliability. Evidence: thermal resistance (°C/W) relates ΔT to dissipated power; time constant τ describes transient response; elevated contact resistance causes localized hotspots that accelerate creep and thermal runaway. Explanation: mounting, contact quality and convection alter Rth and τ; poor contact can double localized heating even if nominal R is unchanged.
2 — Test Setup & Methodology (reproducible bench protocol)
2.1 — Hardware, instrumentation and safety checklist
Point: robust instrumentation and safety are prerequisites. Evidence: required items include a high‑current source or load bank rated ≥1,200 A, four‑wire Kelvin harnesses, low‑noise nanovoltmeter or DAQ, calibrated thermocouples, IR camera, rigid shunt fixtures, heavy cabling and fast fusing. Explanation: sample rates of 1–10 Hz for temperatures and 10–1,000 Hz for voltage transients capture both steady trends and short pulses; PPE and clear short‑circuit protocols are mandatory for ~1,000 A tests.
2.2 — Step‑by‑step test procedure & calibration
Point: repeatability requires a defined sequence. Evidence: perform prechecks, zero‑offset calibrations, incremental current ramps (e.g., 100 A steps to 1,000 A), dwell until thermal steady state, then pulsed tests for transient metrics. Explanation: place thermocouples on shunt body, under mounting points and on nearby ambient; use IR imaging to locate hotspots and cross‑validate TC readings; repeat runs to quantify repeatability and uncertainty.
3 — Thermal Bench Test Data & Analysis
3.1 — Steady‑state results: ΔT vs power and derived Rth (°C/W)
Point: steady ΔT vs P yields Rth. Evidence: record Power, Current, Vdrop, ΔT and compute Rth = ΔT/P; include bench test data plots (ΔT vs P, Vdrop vs I). Explanation: table templates and plots reveal linear regions, contact anomalies and the practical continuous rating for a 50W shunt under given mounting.
| Power (W) | Current (A) | Vdrop (mV) | ΔT (°C) | Rth (°C/W) |
|---|---|---|---|---|
| 10 | 447 | 22 | 12 | 1.2 |
| 25 | 707 | 35 | 35 | 1.4 |
| 50 | 1,000 | 50 | 90 | 1.8 |
3.2 — Transient behavior and time constants
Point: time constant τ governs pulsed operation margins. Evidence: step tests (0→50 W) show temperature rising toward steady state with an approximately single‑exponential envelope; exponential fits extract τ on the order of seconds to minutes depending on thermal mass and mounting. Explanation: shorter τ favors pulsed duty; long τ requires conservative continuous derating to avoid thermal accumulation.
3.3 — Electrical drift: TCR and resistance change with temperature
Point: resistance changes can bias current measurement. Evidence: resistance vs temperature curve yields TCR in ppm/°C; observed hysteresis after cool‑down signals mechanical relaxation or contact changes. Explanation: quantify TCR for meter calibration and define drift acceptance criteria for long‑term stability and meter accuracy.
4 — Comparative Cases: Mounting, Cooling & Contact Variations
4.1 — Case A — Free‑air (unmounted) vs bolted to copper block
Point: mounting vastly changes Rth. Evidence: unmounted shunt in free air shows high ΔT and Rth; when bolted to a copper block Rth drops significantly and ΔT for 50 W can halve. Explanation: torque spec and contact area are critical—insufficient torque or thin washers raise contact resistance and local heating despite identical nominal shunt resistance.
4.2 — Case B — PCB‑mounted (with/without thermal vias) and forced convection
Point: PCB implementations require thermal design. Evidence: copper pour area, via count and airflow (CFM) reduce ΔT; forced convection can convert a 50W shunt from unsafe continuous operation to acceptable with proper copper mass. Explanation: provide thresholds for continuous vs pulsed operation based on measured Rth and available PCB thermal path.
5 — Practical Recommendations for Designers & Testers
5.1 — Design guidelines and derating rules
Point: translate bench metrics into rules of thumb. Evidence: expect Rth ranges ~1.0–2.5 °C/W depending on mounting; derate continuous power by 20–50% unless bolted to a low‑Rth sink; for ARCS8536FL050A9 verify torque, pad area and via count against measured ΔT. Explanation: use busbars or copper blocks for continuous 50W shunt operation and reserve PCB mounting for pulsed duty unless heavy thermal vias and pours are implemented.
5.2 — Measurement best practices and acceptance criteria
Point: set clear pass/fail and measurement rules. Evidence: require four‑wire measurement, low‑noise cabling, averaging for voltage, and post‑cycle inspection. Define acceptance: max ΔT, TCR drift limits (ppm/°C), and no visible damage after N cycles. Explanation: include diagnostic plots (ΔT vs P, resistance vs temperature, transient fits) with every report to document compliance.
Summary
- Measured bench test data for a 50µΩ shunt shows ~1,000 A needed for 50 W and ΔT that depends strongly on mounting and airflow; designers should use ΔT vs P to compute Rth and continuous limits.
- Key actionable steps: use four‑wire measurement and calibrated thermocouples, validate mounting thermal path with copper blocks or busbars, and apply a conservative derating for continuous 50W shunt operation.
- Document transient τ, TCR and post‑cycle hysteresis to set acceptance criteria and translate bench numbers into system derating and safety margins.
Additional author instructions (to make writing straightforward)
What specific checks should be done when testing ARCS8536FL050A9 for 50 W operation?
Perform zero‑offset calibration, verify Kelvin wiring integrity, measure Vdrop at steady current and map surface temperature with thermocouples and IR. Log torque values for all fasteners and run at least three repeat ramps to quantify repeatability and uncertainty in ΔT and Rth.
How should one report bench test data for a 50µΩ shunt to validate design decisions?
Include ΔT vs P plots, Vdrop vs I traces, resistance vs temperature table with computed TCR, transient exponential fits to extract τ, and photos/IR images of hotspot locations. State measurement uncertainty, mounting details, airflow and torque to allow reproducibility.
What acceptance criteria are practical after N thermal cycles for a 50W shunt?
Acceptable criteria: no visible deformation or damage, TCR within specified ppm/°C drift limits, resistance change within a defined percentage (e.g., <0.1% after N cycles) and ΔT under the system limit for intended continuous or pulsed duty. Document cycles and ambient conditions for traceability.
Frequently Asked Questions
What specific checks should be done when testing ARCS8536FL050A9 for 50 W operation?
Perform zero-offset calibration, verify Kelvin wiring integrity, measure Vdrop at steady current and map surface temperature with thermocouples and IR. Log torque values for all fasteners and run at least three repeat ramps to quantify repeatability and uncertainty in ΔT and Rth.
How should one report bench test data for a 50µΩ shunt to validate design decisions?
Include ΔT vs P plots, Vdrop vs I traces, resistance vs temperature table with computed TCR, transient exponential fits to extract τ, and photos/IR images of hotspot locations. State measurement uncertainty, mounting details, airflow and torque to allow reproducibility.
What acceptance criteria are practical after N thermal cycles for a 50W shunt?
Acceptable criteria: no visible deformation or damage, TCR within specified ppm/°C drift limits, resistance change within a defined percentage (e.g., <0.1% after N cycles) and ΔT under the system limit for intended continuous or pulsed duty. Document cycles and ambient conditions for traceability.
How does mounting affect the thermal resistance (Rth) of a 50µΩ shunt?
Mounting drastically changes Rth. An unmounted shunt in free air exhibits high temperature rise, whereas bolting the shunt directly to a copper block or busbar significantly reduces Rth and halves the temperature rise at 50W dissipation due to enhanced thermal conduction.